Oct. 31st 2025
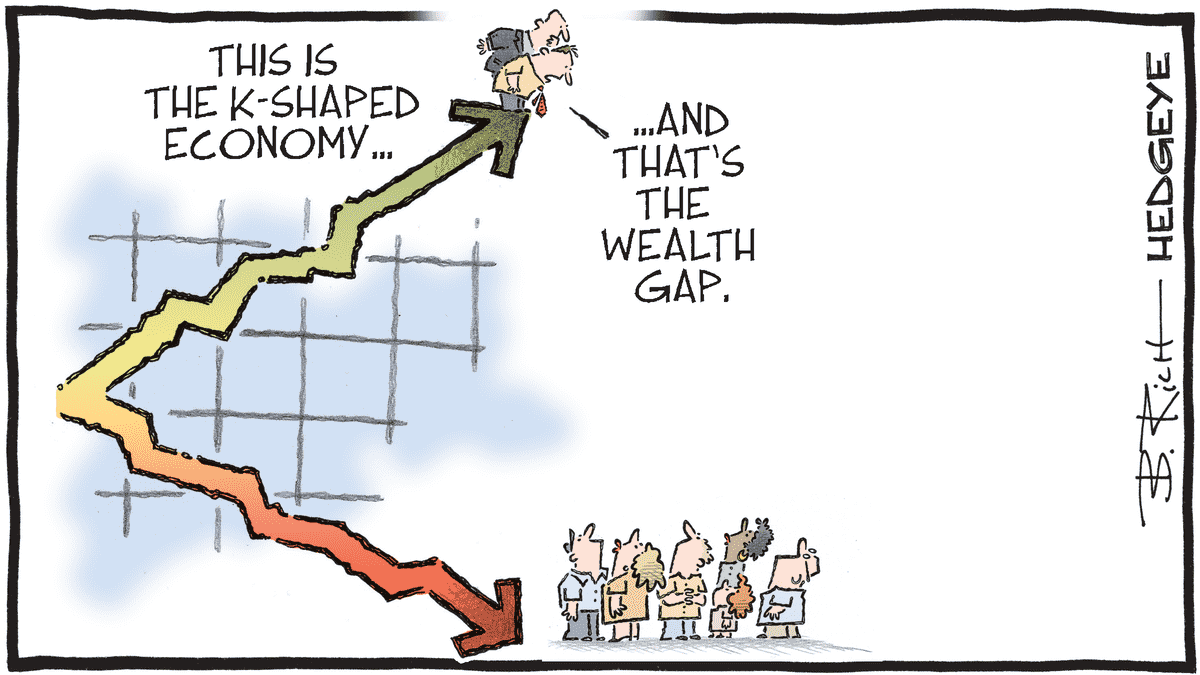
Bubble or K-shaped Economy?
Market Signal: +7 STRONG BULLISH
Lately there is a lot of worry about an impending bubble pop, and a lot of wonder about how the stock market can be doing so well amid wider signs of economic fragility.
As previously stated, while the stock market is often used as a proxy for economic health, it is not the economy itself.
As Paul Krugman notes, "Aside from the question of whether this is a bubble, it’s important to be aware that the top 10 percent of households own 87 percent of equities, while the bottom half own almost no stock at all and gain nothing from a rising market."
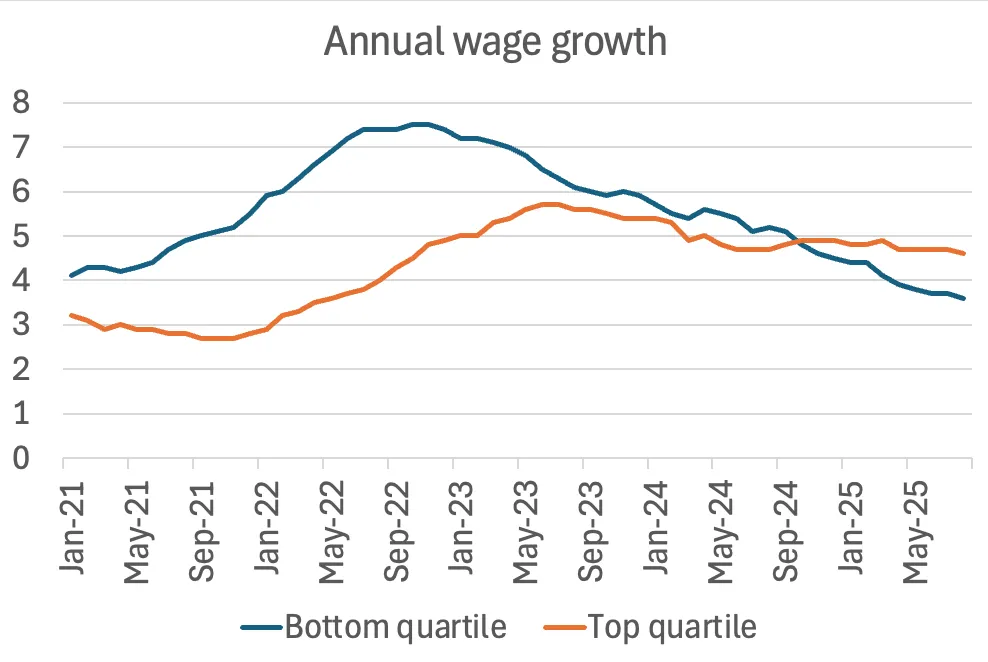
Simultaneously, the rate of wage growth for the top 25% of earners has exceeded that of the bottom 25% of earners:
The top 10% of earners in America were responsible for almost half (49.2%) of total consumer spending during Q2:
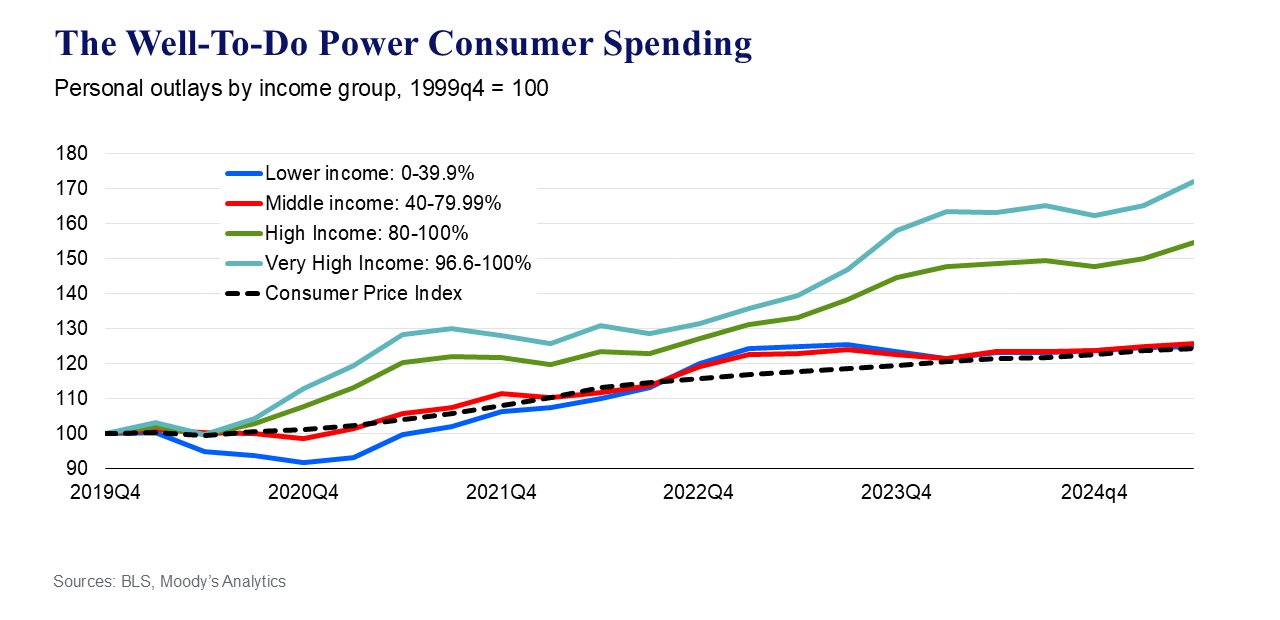
For those in the bottom 80% of the income distribution, those making less than approximately $175,000 a year – their spending has simply kept pace with inflation since the pandemic. The 20% of households that make more have done much better, and those in the top 3.3% of the distribution have done much, much, much better. The data also show that the U.S. economy is being largely powered by the well-to-do.
The stock market is somewhat (increasingly) divorced from the real economy. Shares are for those that can afford to hold them. In a K-shaped economy, opportunity accrues to those with the means to invest, while the rest face increasing disadvantage.
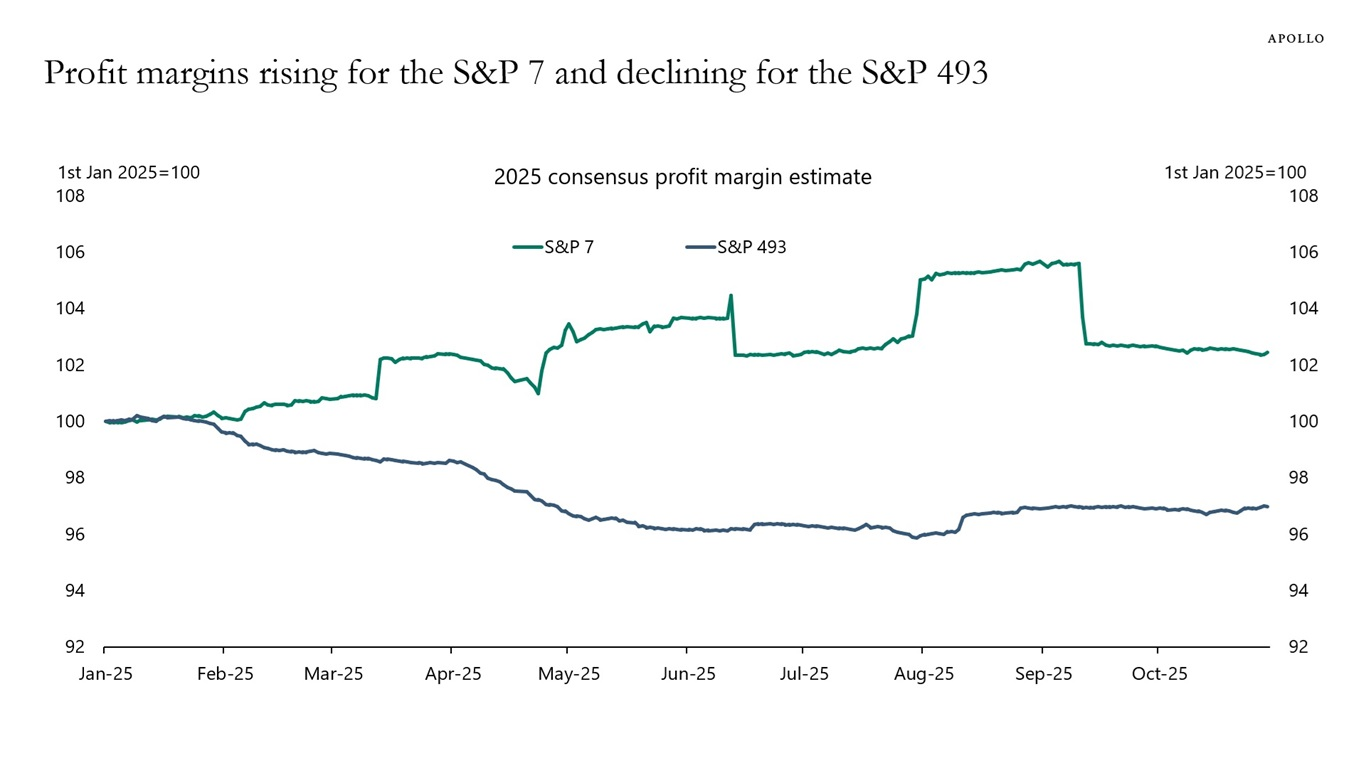
An analogous K-shaped skew is observed between the Magnificent 7 and the other S&P 500 holdings.
Nvidia's market cap is larger than the GDP of most countries on Earth — only the U.S., China, and Germany have economies bigger than $5T nominally.
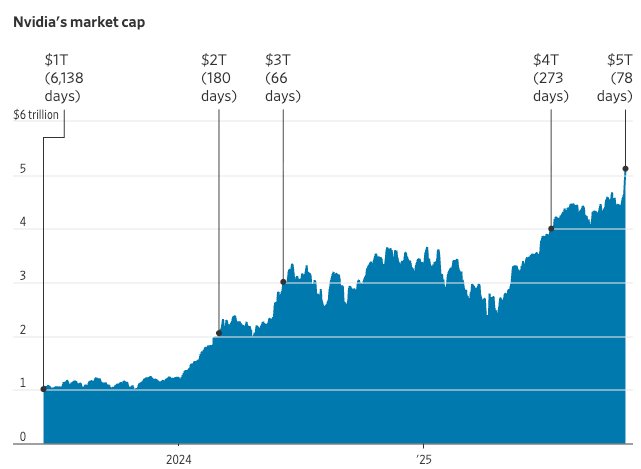
The Magnificent 7 make up about 37% of the S&P 500. The S&P 500 makes up about 45% of global market cap (roughly 124T). This means that the Magnificent 7 are approximately 16.65% of the entire global stock market capitalization - essentially one giant bet on AI.

This concentration may seem extreme, but it's not the most extreme in history:
In 1812, financial stocks—banks and insurance companies—constituted an estimated 71% of total U.S. stock-market capitalization. In 1900, railroads accounted for 63% of total U.S. stock-market value.
The thing is, no one knows when a bubble will pop. Scott Galloway described this phenomenon in a recent Pivot episode:
So like I said, the economists called the dot-com implosion perfectly, but they called it in 1997 before those stocks went up another 30 or 40 percent. So do we know they’re going to come down? Yeah, the hard part is figuring out when they’re going to come down and if they’re going to scream to new highs. Now, what I see is effectively America right now is a giant bet on AI.
Raincheck Fund will remain long until the Market Signal goes negative or declines in abrupt, significant fashion.
NASDAQ-100 52-week highs
The following NASDAQ-100 (QQQ) holdings closed at a 52-week high today:
AMZN $244.22 +9.58%PLTR $200.47 +3.04%CSCO $73.11 +0.27%WBD $22.45 +3.84%ZS $331.14 +2.83%
📈128th day of uptrend
Day 📈1 of current uptrend occurred on Thurs. May 1st 2025.
QQQ+30.60% since start of current uptrendTQQQ+105.60% since start of current uptrend
| A | B | C | D | E | F | G | |
|---|---|---|---|---|---|---|---|
|
1
|
Market Signal | Trend Count | QQQ Close | QQQ %chg since 📈1 | TQQQ close | TQQQ %chg since 📈1 | Date |
|
2
|
2 | 📈1 | $481.68 | 0.00% | $56.77 | 0.00% | Thu 5/1/25 |
|
3
|
2 | 📈2 | $488.83 | 1.48% | $59.43 | 4.69% | Fri 5/2/25 |
|
4
|
2 | 📈3 | $485.93 | 0.88% | $58.40 | 2.87% | Mon 5/5/25 |
|
5
|
2 | 📈4 | $481.41 | -0.06% | $56.74 | -0.05% | Tue 5/6/25 |
|
6
|
2 | 📈5 | $483.30 | 0.34% | $57.40 | 1.11% | Wed 5/7/25 |
|
7
|
2 | 📈6 | $488.29 | 1.37% | $59.11 | 4.12% | Thu 5/8/25 |
|
8
|
2 | 📈7 | $487.97 | 1.31% | $58.97 | 3.88% | Fri 5/9/25 |
|
9
|
3 | 📈8 | $507.85 | 5.43% | $66.11 | 16.45% | Mon 5/12/25 |
|
10
|
3 | 📈9 | $515.59 | 7.04% | $69.14 | 21.79% | Tue 5/13/25 |
|
11
|
3 | 📈10 | $518.68 | 7.68% | $70.36 | 23.94% | Wed 5/14/25 |
|
12
|
3 | 📈11 | $519.25 | 7.80% | $70.58 | 24.33% | Thu 5/15/25 |
|
13
|
3 | 📈12 | $521.51 | 8.27% | $71.45 | 25.86% | Fri 5/16/25 |
|
14
|
3 | 📈13 | $522.01 | 8.37% | $71.64 | 26.19% | Mon 5/19/25 |
|
15
|
3 | 📈14 | $520.27 | 8.01% | $70.89 | 24.87% | Tue 5/20/25 |
|
16
|
3 | 📈15 | $513.04 | 6.51% | $67.94 | 19.68% | Wed 5/21/25 |
|
17
|
2 | 📈16 | $514.00 | 6.71% | $68.29 | 20.29% | Thu 5/22/25 |
|
18
|
2 | 📈17 | $509.24 | 5.72% | $66.32 | 16.82% | Fri 5/23/25 |
|
19
|
4 | 📈18 | $521.22 | 8.21% | $70.94 | 24.96% | Tue 5/27/25 |
|
20
|
3 | 📈19 | $518.91 | 7.73% | $70.03 | 23.36% | Wed 5/28/25 |
|
21
|
3 | 📈20 | $519.93 | 7.94% | $70.37 | 23.96% | Thu 5/29/25 |
|
22
|
3 | 📈21 | $519.11 | 7.77% | $70.00 | 23.30% | Fri 5/30/25 |
|
23
|
4 | 📈22 | $523.21 | 8.62% | $71.61 | 26.14% | Mon 6/2/25 |
|
24
|
4 | 📈23 | $527.30 | 9.47% | $73.28 | 29.08% | Tue 6/3/25 |
|
25
|
3 | 📈24 | $528.77 | 9.78% | $73.87 | 30.12% | Wed 6/4/25 |
|
26
|
3 | 📈25 | $524.79 | 8.95% | $72.15 | 27.09% | Thu 6/5/25 |
|
27
|
4 | 📈26 | $529.92 | 10.01% | $74.21 | 30.72% | Fri 6/6/25 |
|
28
|
3 | 📈27 | $530.70 | 10.18% | $74.54 | 31.30% | Mon 6/9/25 |
|
29
|
3 | 📈28 | $534.21 | 10.91% | $75.98 | 33.84% | Tue 6/10/25 |
|
30
|
3 | 📈29 | $532.41 | 10.53% | $75.20 | 32.46% | Wed 6/11/25 |
|
31
|
3 | 📈30 | $533.66 | 10.79% | $75.69 | 33.33% | Thu 6/12/25 |
|
32
|
2 | 📈31 | $526.96 | 9.40% | $72.83 | 28.29% | Fri 6/13/25 |
|
33
|
3 | 📈32 | $534.29 | 10.92% | $75.80 | 33.52% | Mon 6/16/25 |
|
34
|
2 | 📈33 | $529.08 | 9.84% | $73.56 | 29.58% | Tue 6/17/25 |
|
35
|
2 | 📈34 | $528.99 | 9.82% | $73.46 | 29.40% | Wed 6/18/25 |
|
36
|
2 | 📈35 | $526.83 | 9.37% | $72.45 | 27.62% | Fri 6/20/25 |
|
37
|
7 | 📈36 | $531.65 | 10.37% | $74.70 | 31.58% | Mon 6/23/25 |
|
38
|
7 | 📈37 | $539.78 | 12.06% | $78.10 | 37.57% | Tue 6/24/25 |
|
39
|
7 | 📈38 | $541.16 | 12.35% | $78.48 | 38.24% | Wed 6/25/25 |
|
40
|
8 | 📈39 | $546.22 | 13.40% | $80.63 | 42.03% | Thu 6/26/25 |
|
41
|
7 | 📈40 | $548.09 | 13.79% | $81.42 | 43.42% | Fri 6/27/25 |
|
42
|
8 | 📈41 | $551.64 | 14.52% | $83.00 | 46.20% | Mon 6/30/25 |
|
43
|
7 | 📈42 | $546.99 | 13.56% | $80.89 | 42.49% | Tue 7/1/25 |
|
44
|
7 | 📈43 | $550.80 | 14.35% | $82.50 | 45.32% | Wed 7/2/25 |
|
45
|
8 | 📈44 | $556.22 | 15.48% | $84.81 | 49.39% | Thu 7/3/25 |
|
46
|
7 | 📈45 | $552.03 | 14.61% | $82.92 | 46.06% | Mon 7/7/25 |
|
47
|
7 | 📈46 | $552.34 | 14.67% | $83.03 | 46.26% | Tue 7/8/25 |
|
48
|
7 | 📈47 | $556.25 | 15.48% | $84.75 | 49.29% | Wed 7/9/25 |
|
49
|
7 | 📈48 | $555.45 | 15.32% | $84.36 | 48.60% | Thu 7/10/25 |
|
50
|
7 | 📈49 | $554.20 | 15.06% | $83.72 | 47.47% | Fri 7/11/25 |
|
51
|
7 | 📈50 | $556.21 | 15.47% | $84.61 | 49.04% | Mon 7/14/25 |
|
52
|
7 | 📈51 | $556.72 | 15.58% | $84.83 | 49.43% | Tue 7/15/25 |
|
53
|
7 | 📈52 | $557.29 | 15.70% | $85.07 | 49.85% | Wed 7/16/25 |
|
54
|
7 | 📈53 | $561.80 | 16.63% | $87.05 | 53.34% | Thu 7/17/25 |
|
55
|
7 | 📈54 | $561.26 | 16.52% | $86.75 | 52.81% | Fri 7/18/25 |
|
56
|
7 | 📈55 | $564.17 | 17.13% | $88.07 | 55.13% | Mon 7/21/25 |
|
57
|
7 | 📈56 | $561.25 | 16.52% | $86.70 | 52.72% | Tue 7/22/25 |
|
58
|
7 | 📈57 | $563.81 | 17.05% | $87.84 | 54.73% | Wed 7/23/25 |
|
59
|
7 | 📈58 | $565.01 | 17.30% | $88.42 | 55.75% | Thu 7/24/25 |
|
60
|
7 | 📈59 | $566.37 | 17.58% | $88.92 | 56.63% | Fri 7/25/25 |
|
61
|
7 | 📈60 | $568.14 | 17.95% | $89.79 | 58.16% | Mon 7/28/25 |
|
62
|
7 | 📈61 | $567.26 | 17.77% | $89.38 | 57.44% | Tue 7/29/25 |
|
63
|
7 | 📈62 | $568.02 | 17.92% | $89.69 | 57.99% | Wed 7/30/25 |
|
64
|
6 | 📈63 | $565.01 | 17.30% | $88.21 | 55.38% | Thu 7/31/25 |
|
65
|
5 | 📈64 | $553.88 | 14.99% | $82.92 | 46.06% | Fri 8/1/25 |
|
66
|
7 | 📈65 | $564.10 | 17.11% | $87.46 | 54.06% | Mon 8/4/25 |
|
67
|
6 | 📈66 | $560.27 | 16.32% | $85.64 | 50.85% | Tue 8/5/25 |
|
68
|
7 | 📈67 | $567.32 | 17.78% | $88.84 | 56.49% | Wed 8/6/25 |
|
69
|
7 | 📈68 | $569.24 | 18.18% | $89.74 | 58.08% | Thu 8/7/25 |
|
70
|
7 | 📈69 | $574.55 | 19.28% | $92.16 | 62.34% | Fri 8/8/25 |
|
71
|
7 | 📈70 | $572.85 | 18.93% | $91.35 | 60.91% | Mon 8/11/25 |
|
72
|
7 | 📈71 | $580.05 | 20.42% | $94.72 | 66.85% | Tue 8/12/25 |
|
73
|
7 | 📈72 | $580.34 | 20.48% | $94.86 | 67.10% | Wed 8/13/25 |
|
74
|
7 | 📈73 | $579.89 | 20.39% | $94.60 | 66.64% | Thu 8/14/25 |
|
75
|
7 | 📈74 | $577.34 | 19.86% | $93.26 | 64.28% | Fri 8/15/25 |
|
76
|
7 | 📈75 | $577.11 | 19.81% | $93.14 | 64.07% | Mon 8/18/25 |
|
77
|
6 | 📈76 | $569.28 | 18.19% | $89.34 | 57.37% | Tue 8/19/25 |
|
78
|
5 | 📈77 | $565.90 | 17.48% | $87.71 | 54.50% | Wed 8/20/25 |
|
79
|
5 | 📈78 | $563.28 | 16.94% | $86.49 | 52.35% | Thu 8/21/25 |
|
80
|
6 | 📈79 | $571.97 | 18.74% | $90.38 | 59.20% | Fri 8/22/25 |
|
81
|
6 | 📈80 | $570.32 | 18.40% | $89.59 | 57.81% | Mon 8/25/25 |
|
82
|
6 | 📈81 | $572.61 | 18.88% | $90.63 | 59.64% | Tue 8/26/25 |
|
83
|
7 | 📈82 | $573.49 | 19.06% | $91.04 | 60.37% | Wed 8/27/25 |
|
84
|
7 | 📈83 | $577.08 | 19.81% | $92.70 | 63.29% | Thu 8/28/25 |
|
85
|
5 | 📈84 | $570.40 | 18.42% | $89.36 | 57.41% | Fri 8/29/25 |
|
86
|
5 | 📈85 | $565.62 | 17.43% | $87.08 | 53.39% | Tue 9/2/25 |
|
87
|
6.5 | 📈86 | $570.07 | 18.35% | $89.11 | 56.97% | Wed 9/3/25 |
|
88
|
7 | 📈87 | $575.23 | 19.42% | $91.52 | 61.21% | Thu 9/4/25 |
|
89
|
7 | 📈88 | $576.06 | 19.59% | $91.82 | 61.74% | Fri 9/5/25 |
|
90
|
7 | 📈89 | $578.87 | 20.18% | $93.13 | 64.05% | Mon 9/8/25 |
|
91
|
7 | 📈90 | $580.51 | 20.52% | $93.89 | 65.39% | Tue 9/9/25 |
|
92
|
7 | 📈91 | $580.70 | 20.56% | $93.99 | 65.56% | Wed 9/10/25 |
|
93
|
7 | 📈92 | $584.08 | 21.26% | $95.57 | 68.35% | Thu 9/11/25 |
|
94
|
7 | 📈93 | $586.66 | 21.79% | $96.76 | 70.44% | Fri 9/12/25 |
|
95
|
7 | 📈94 | $591.68 | 22.84% | $99.23 | 74.79% | Mon 9/15/25 |
|
96
|
7 | 📈95 | $591.18 | 22.73% | $98.96 | 74.32% | Tue 9/16/25 |
|
97
|
7 | 📈96 | $590.00 | 22.49% | $98.33 | 73.21% | Wed 9/17/25 |
|
98
|
7 | 📈97 | $595.32 | 23.59% | $100.98 | 77.88% | Thu 9/18/25 |
|
99
|
7 | 📈98 | $599.35 | 24.43% | $102.98 | 81.40% | Fri 9/19/25 |
|
100
|
7 | 📈99 | $602.20 | 25.02% | $104.72 | 84.46% | Mon 9/22/25 |
|
101
|
7 | 📈100 | $598.20 | 24.19% | $102.61 | 80.75% | Tue 9/23/25 |
|
102
|
7 | 📈101 | $596.10 | 23.75% | $101.41 | 78.63% | Wed 9/24/25 |
|
103
|
6 | 📈102 | $593.53 | 23.22% | $100.05 | 76.24% | Thu 9/25/25 |
|
104
|
7 | 📈103 | $595.97 | 23.73% | $101.25 | 78.35% | Fri 9/26/25 |
|
105
|
7 | 📈104 | $598.73 | 24.30% | $102.60 | 80.73% | Mon 9/29/25 |
|
106
|
7 | 📈105 | $600.37 | 24.64% | $103.40 | 82.14% | Tue 9/30/25 |
|
107
|
7 | 📈106 | $603.25 | 25.24% | $104.86 | 84.71% | Wed 10/1/25 |
|
108
|
8 | 📈107 | $605.73 | 25.75% | $106.14 | 86.96% | Thu 10/2/25 |
|
109
|
7 | 📈108 | $603.18 | 25.22% | $104.70 | 84.43% | Fri 10/3/25 |
|
110
|
8 | 📈109 | $607.71 | 26.16% | $107.04 | 88.55% | Mon 10/6/25 |
|
111
|
7 | 📈110 | $604.51 | 25.50% | $105.31 | 85.50% | Tue 10/7/25 |
|
112
|
8 | 📈111 | $611.44 | 26.94% | $108.88 | 91.79% | Wed 10/8/25 |
|
113
|
7 | 📈112 | $610.70 | 26.79% | $108.45 | 91.03% | Thu 10/9/25 |
|
114
|
5 | 📈113 | $589.50 | 22.38% | $97.07 | 70.99% | Fri 10/10/25 |
|
115
|
4 | 📈114 | $602.01 | 24.98% | $103.23 | 81.84% | Mon 10/13/25 |
|
116
|
6 | 📈115 | $598.00 | 24.15% | $101.13 | 78.14% | Tue 10/14/25 |
|
117
|
6 | 📈116 | $602.22 | 25.02% | $103.20 | 81.79% | Wed 10/15/25 |
|
118
|
6 | 📈117 | $599.99 | 24.56% | $102.05 | 79.76% | Thu 10/16/25 |
|
119
|
7 | 📈118 | $603.93 | 25.38% | $103.99 | 83.18% | Fri 10/17/25 |
|
120
|
8 | 📈119 | $611.54 | 26.96% | $107.89 | 90.05% | Mon 10/20/25 |
|
121
|
7 | 📈120 | $611.38 | 26.93% | $107.77 | 89.84% | Tue 10/21/25 |
|
122
|
7 | 📈121 | $605.49 | 25.70% | $104.60 | 84.25% | Wed 10/22/25 |
|
123
|
7 | 📈122 | $610.58 | 26.76% | $107.22 | 88.87% | Thu 10/23/25 |
|
124
|
8 | 📈123 | $617.10 | 28.11% | $110.56 | 94.75% | Fri 10/24/25 |
|
125
|
8 | 📈124 | $628.09 | 30.40% | $116.43 | 105.09% | Mon 10/27/25 |
|
126
|
8 | 📈125 | $632.92 | 31.40% | $119.09 | 109.78% | Tue 10/28/25 |
|
127
|
8 | 📈126 | $635.77 | 31.99% | $120.61 | 112.45% | Wed 10/29/25 |
|
128
|
7 | 📈127 | $626.05 | 29.97% | $115.09 | 102.73% | Thu 10/30/25 |
|
129
|
📈128 | $629.07 | 30.60% | $116.72 | 105.60% | Fri 10/31/25 |
Market Signal, Trend Count, closing prices, and cumulative return (%) over current uptrend
TQQQ vs QQQ Holdings
TQQQ is outperforming 95% of QQQ holdings (including all of the Magnificent 7) since day 📈1 of current uptrend (Thurs. May 1st 2025).
| A | B | C | D | E | |
|---|---|---|---|---|---|
|
1
|
Market Cap | Symbol | %Chg since 📈1 | Close on 📈1 | Close |
|
2
|
409,525 M | QQQ | 30.60% | $481.68 | $629.07 |
|
3
|
251,174 M | MU | 187.73% | $77.77 | $223.77 |
|
4
|
55,581 M | WBD | 166.31% | $8.43 | $22.45 |
|
5
|
415,643 M | AMD | 165.00% | $96.65 | $256.12 |
|
6
|
215,577 M | APP | 128.03% | $279.49 | $637.33 |
|
7
|
197,774 M | LRCX | 119.52% | $71.73 | $157.46 |
|
8
|
30,610 M | TQQQ | 105.60% | $56.77 | $116.72 |
|
9
|
190,592 M | INTC | 100.15% | $19.98 | $39.99 |
|
10
|
1,745,528 M | AVGO | 87.32% | $197.33 | $369.63 |
|
11
|
4,930,024 M | NVDA | 81.43% | $111.61 | $202.49 |
|
12
|
225,959 M | SHOP | 79.22% | $97.01 | $173.86 |
|
13
|
159,172 M | KLAC | 78.73% | $676.31 | $1,208.74 |
|
14
|
3,395,932 M | GOOGL | 74.33% | $161.30 | $281.19 |
|
15
|
3,403,540 M | GOOG | 73.12% | $162.79 | $281.82 |
|
16
|
475,583 M | PLTR | 72.52% | $116.20 | $200.47 |
|
17
|
1,518,436 M | TSLA | 62.75% | $280.52 | $456.56 |
|
18
|
411,138 M | ASML | 58.87% | $666.72 | $1,059.23 |
|
19
|
117,777 M | CEG | 56.68% | $240.62 | $377.00 |
|
20
|
185,697 M | AMAT | 56.48% | $148.96 | $233.10 |
|
21
|
80,813 M | MRVL | 53.80% | $60.95 | $93.74 |
|
22
|
56,779 M | DDOG | 53.13% | $106.32 | $162.81 |
|
23
|
179,884 M | ARM | 47.16% | $115.40 | $169.82 |
|
24
|
52,420 M | ZS | 45.84% | $227.06 | $331.14 |
|
25
|
49,884 M | EA | 37.88% | $145.10 | $200.06 |
|
26
|
33,687 M | MCHP | 35.75% | $45.98 | $62.42 |
|
27
|
195,191 M | QCOM | 33.79% | $135.21 | $180.90 |
|
28
|
47,770 M | BKR | 33.77% | $36.19 | $48.41 |
|
29
|
50,364 M | IDXX | 33.55% | $471.38 | $629.51 |
|
30
|
108,666 M | DASH | 29.65% | $196.20 | $254.37 |
|
31
|
2,604,585 M | AMZN | 28.40% | $190.20 | $244.22 |
|
32
|
67,074 M | CSX | 28.14% | $28.11 | $36.02 |
|
33
|
22,618 M | BIIB | 27.57% | $120.93 | $154.27 |
|
34
|
191,468 M | PDD | 27.27% | $105.97 | $134.87 |
|
35
|
4,012,396 M | AAPL | 26.74% | $213.32 | $270.37 |
|
36
|
20,481 M | ON | 26.46% | $39.60 | $50.08 |
|
37
|
288,106 M | CSCO | 25.79% | $58.12 | $73.11 |
|
38
|
136,271 M | CRWD | 25.73% | $431.88 | $543.01 |
|
39
|
3,848,559 M | MSFT | 21.72% | $425.40 | $517.81 |
|
40
|
115,182 M | ADI | 20.85% | $193.74 | $234.13 |
|
41
|
149,074 M | PANW | 18.24% | $186.27 | $220.24 |
|
42
|
57,483 M | AXON | 17.89% | $621.10 | $732.23 |
|
43
|
255,483 M | AZN | 16.86% | $70.51 | $82.40 |
|
44
|
148,636 M | GILD | 16.02% | $103.25 | $119.79 |
|
45
|
48,006 M | XEL | 15.30% | $70.40 | $81.17 |
|
46
|
52,630 M | NXPI | 15.00% | $181.84 | $209.12 |
|
47
|
51,685 M | ROST | 14.39% | $138.93 | $158.92 |
|
48
|
1,628,747 M | META | 13.31% | $572.21 | $648.35 |
|
49
|
92,192 M | CDNS | 13.00% | $299.73 | $338.69 |
|
50
|
65,255 M | MNST | 12.28% | $59.52 | $66.83 |
|
51
|
64,371 M | AEP | 11.83% | $107.54 | $120.26 |
|
52
|
34,141 M | GEHC | 10.76% | $67.67 | $74.95 |
|
53
|
68,504 M | REGN | 10.47% | $590.00 | $651.80 |
|
54
|
64,185 M | ADSK | 10.18% | $273.49 | $301.34 |
|
55
|
51,680 M | PCAR | 9.60% | $89.78 | $98.40 |
|
56
|
199,755 M | PEP | 9.39% | $133.55 | $146.09 |
|
57
|
47,293 M | TTWO | 9.01% | $235.17 | $256.37 |
|
58
|
186,116 M | INTU | 7.12% | $623.19 | $667.55 |
|
59
|
70,736 M | MAR | 6.82% | $243.95 | $260.58 |
|
60
|
41,452 M | FANG | 6.20% | $134.83 | $143.19 |
|
61
|
64,813 M | PYPL | 5.90% | $65.41 | $69.27 |
|
62
|
160,663 M | AMGN | 5.16% | $283.78 | $298.43 |
|
63
|
189,400 M | ISRG | 3.31% | $517.18 | $534.28 |
|
64
|
77,472 M | ABNB | 2.04% | $124.01 | $126.54 |
|
65
|
146,706 M | TXN | 2.02% | $158.26 | $161.46 |
|
66
|
47,242 M | FAST | 1.97% | $40.35 | $41.15 |
|
67
|
117,986 M | MELI | 1.43% | $2,294.52 | $2,327.26 |
|
68
|
19,757 M | GFS | 1.19% | $35.18 | $35.60 |
|
69
|
79,899 M | ORLY | 0.63% | $93.85 | $94.44 |
|
70
|
163,675 M | BKNG | -0.46% | $5,101.43 | $5,077.74 |
|
71
|
40,090 M | CCEP | -0.79% | $89.54 | $88.83 |
|
72
|
46,581 M | EXC | -1.03% | $46.60 | $46.12 |
|
73
|
84,296 M | SNPS | -1.21% | $459.36 | $453.82 |
|
74
|
474,097 M | NFLX | -1.29% | $1,133.47 | $1,118.86 |
|
75
|
91,941 M | SBUX | -1.39% | $82.01 | $80.87 |
|
76
|
20,887 M | CDW | -1.87% | $162.40 | $159.37 |
|
77
|
64,059 M | WDAY | -2.71% | $246.61 | $239.92 |
|
78
|
35,175 M | CTSH | -3.12% | $75.23 | $72.88 |
|
79
|
127,822 M | HON | -4.47% | $210.74 | $201.33 |
|
80
|
24,584 M | TTD | -5.24% | $53.06 | $50.28 |
|
81
|
196,145 M | LIN | -6.64% | $448.05 | $418.30 |
|
82
|
29,512 M | ODFL | -6.73% | $150.56 | $140.42 |
|
83
|
403,936 M | COST | -8.77% | $999.04 | $911.45 |
|
84
|
142,454 M | ADBE | -9.16% | $374.63 | $340.31 |
|
85
|
29,163 M | CSGP | -10.15% | $76.58 | $68.81 |
|
86
|
73,650 M | CTAS | -12.54% | $209.55 | $183.27 |
|
87
|
105,395 M | ADP | -12.85% | $298.69 | $260.30 |
|
88
|
29,272 M | KHC | -13.23% | $28.50 | $24.73 |
|
89
|
109,112 M | VRTX | -14.69% | $498.86 | $425.57 |
|
90
|
234,942 M | TMUS | -14.96% | $247.00 | $210.05 |
|
91
|
74,144 M | MDLZ | -15.34% | $67.87 | $57.46 |
|
92
|
66,228 M | FTNT | -17.06% | $104.21 | $86.43 |
|
93
|
22,831 M | DXCM | -17.14% | $70.26 | $58.22 |
|
94
|
68,982 M | TRI | -17.59% | $185.74 | $153.06 |
|
95
|
102,773 M | CMCSA | -17.70% | $33.82 | $27.84 |
|
96
|
48,012 M | ROP | -19.99% | $557.59 | $446.15 |
|
97
|
42,118 M | PAYX | -20.18% | $146.61 | $117.03 |
|
98
|
36,899 M | KDP | -20.21% | $34.04 | $27.16 |
|
99
|
30,489 M | VRSK | -25.72% | $294.51 | $218.76 |
|
100
|
44,597 M | TEAM | -26.04% | $229.07 | $169.42 |
|
101
|
41,627 M | CPRT | -28.91% | $60.50 | $43.01 |
|
102
|
77,379 M | MSTR | -29.37% | $381.60 | $269.51 |
|
103
|
20,223 M | LULU | -36.51% | $268.60 | $170.54 |
|
104
|
31,940 M | CHTR | -38.95% | $383.00 | $233.84 |
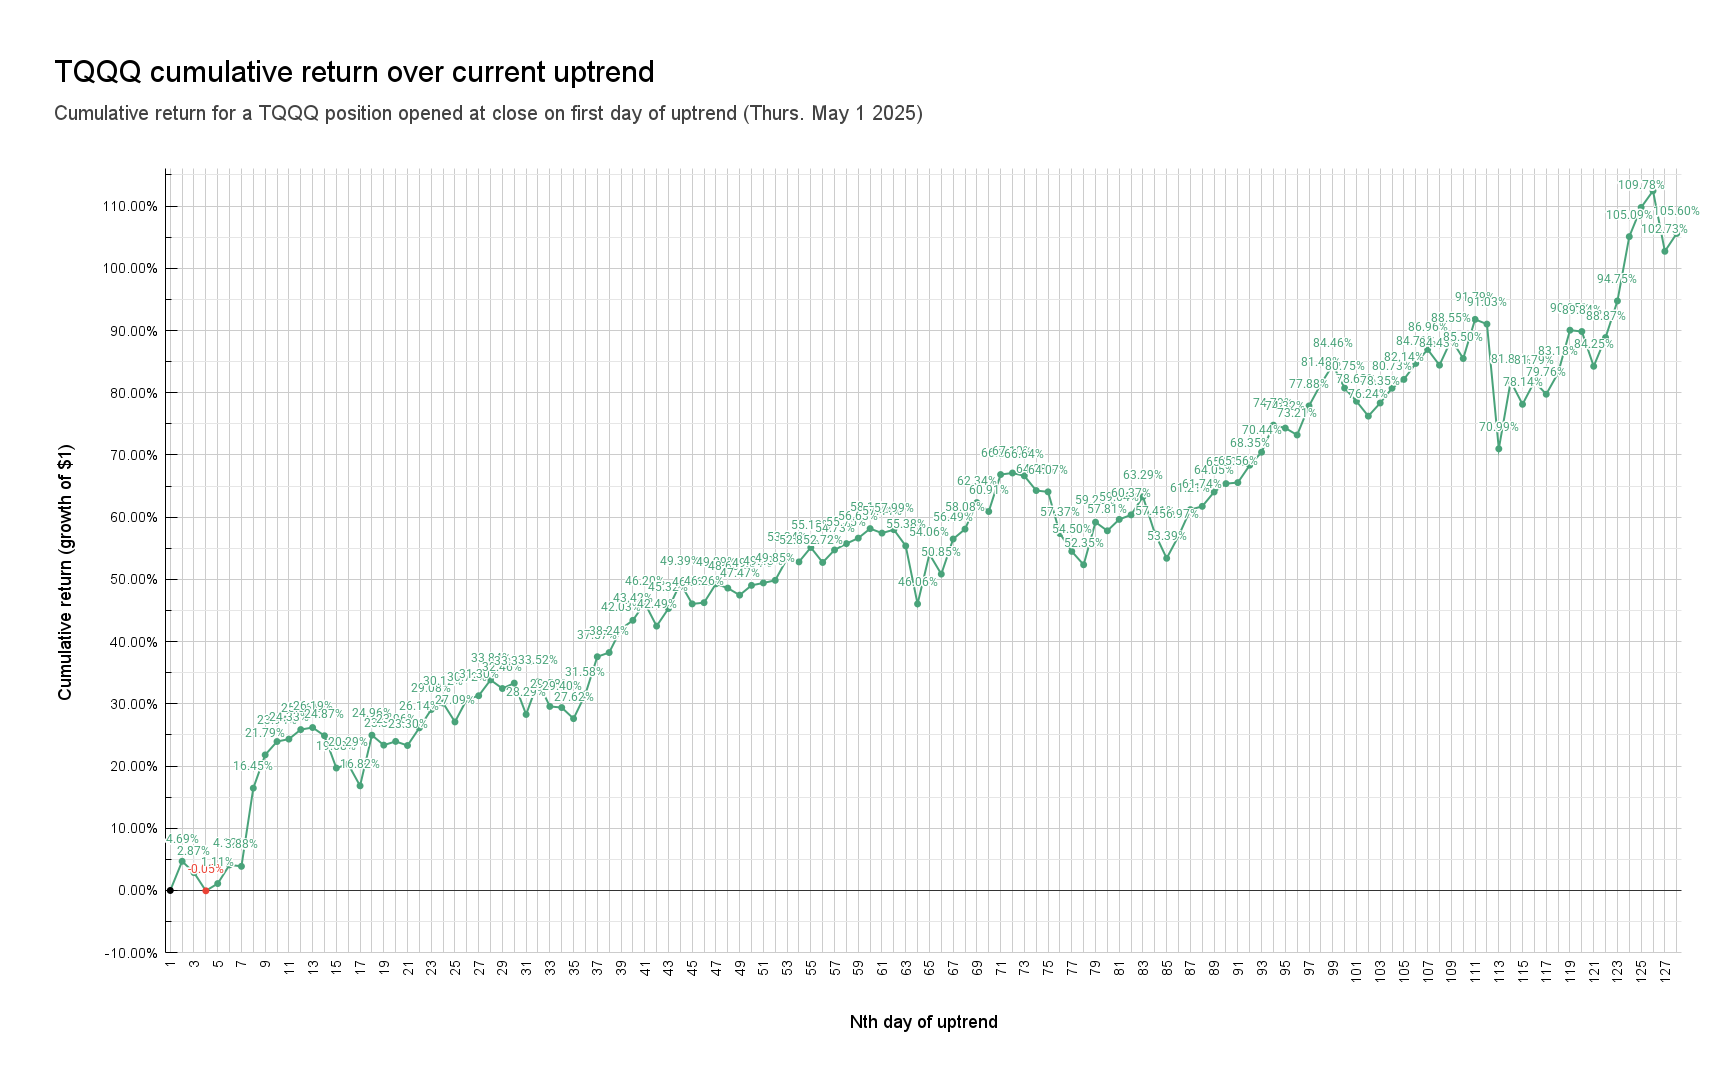
Assuming 3% for the risk-free rate, the Sharpe Ratio for this investment is 3.48.
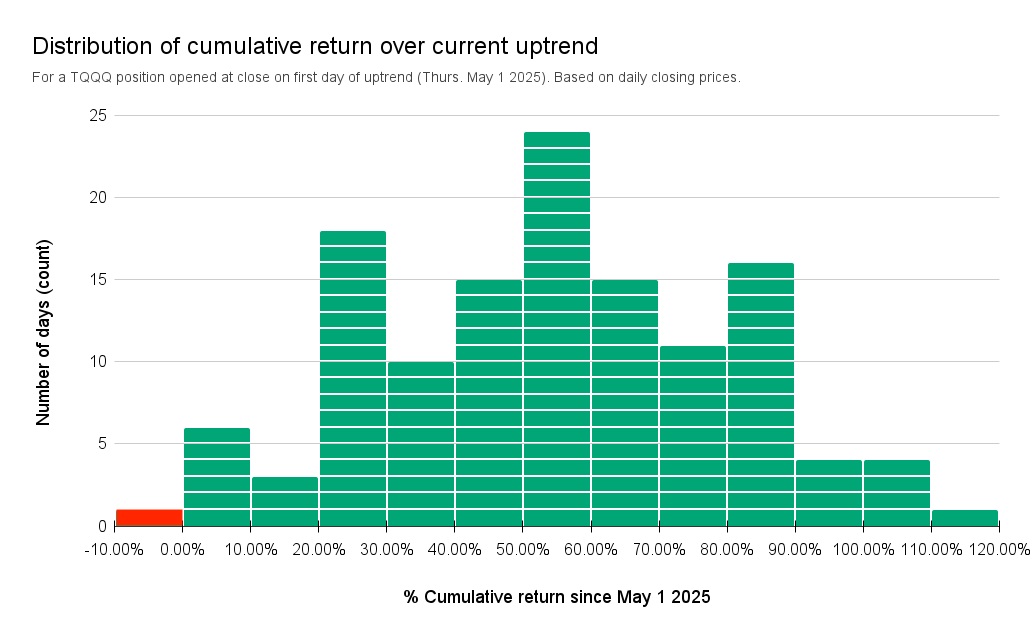
A TQQQ position opened at close on day 📈1 of current uptrend (Thurs. May 1st 2025) was up +50% or more for a majority of the time.
75 of 128 days, or 58.59% of the uptrend, offered the opportunity to exit for a return of +50% or more.
Disclaimer: The information that Raincheck Fund provides is general in nature as it has been prepared without taking account of your objectives, financial situation or needs. It is not intended as legal, financial or investment advice and should not be construed or relied on as such. Raincheck Fund is for information purposes only. Raincheck Fund is not responsible for any damages or losses that may occur as a result of reliance on this information. Before making any commitment of a legal or financial nature you should seek advice from a qualified and registered legal practitioner or financial or investment adviser.
All content, group, messaging, tweets, newsletter, article, and email created by Raincheck Fund is intended for educational and information purposes only, is not financial, investment, legal or tax advice, and is a restatement, summary or extract of other data and research reports that are widely distributed and publicly available. Raincheck Fund is not a registered financial, investment, legal or tax advisor and is not liable for any financial loss you may incur acting on any information provided by Raincheck Fund.
Investment advice provided solely by Autopilot advisers LLC, an SEC registered investment advisor. Past performance does not guarantee future results. Investing carries risks, including the risk of the loss of principal.
Investing in securities involves significant risk, including the risk of loss of principal. Past performance does not guarantee future results, and there can be no assurance that any investment strategy or security will meet its objectives or achieve any specific financial outcome. You should only invest risk capital that you can afford to lose without impacting your financial stability. Carefully consider your individual financial situation, investment goals, and risk tolerance before making any investment decisions.