About
Raincheck Fund is a systematic trading strategy for the triple-leveraged (3x) NASDAQ-100 ETFs (TQQQ & SQQQ).
Market Signal
Our Market Signal is an algorithm that evaluates statistical trends in price action of QQQ and its holdings to determine whether QQQ is currently in an uptrend (📈) or downtrend (📉).
Every day after market close, our Market Signal algorithm returns a numerical market sentiment value, ranging from -9 (most bearish) to +9 (most bullish), with 0 being a neutral score.
📈 Uptrends
QQQ is considered to be in an uptrend during consecutive days of positive Market Signal values
- values in range
+1to+3are a NEUTRAL to WEAK BULLISH indication 📈 - values in range
+4to+6are a MODERATE BULLISH indication 📈📈 - values in range
+7to+9are a STRONG BULLISH indication 📈📈📈
📉 Downtrends
QQQ is considered to be in a downtrend during consecutive days of negative Market Signal values
- values in range
-1to-3are a NEUTRAL to WEAK BEARISH indication 📉 - values in range
-4to-6are a MODERATE BEARISH indication 📉📉 - values in range
-7to-9are a STRONG BEARISH indication 📉📉📉
Raincheck Fund's strategy seeks to profit by capitalizing on how the market is currently behaving, as opposed to predicting what it will do next. Investments are made based on the strength and direction of the Market Signal:
- Long
TQQQduring uptrends - In cash (or
SQQQ) during downtrends
The position is managed as follows:
- 60% to 70% of capital deployed to
TQQQat start of uptrend 📈- *During downtrends 📉 capital is allocated
SQQQ, but only 20% to 30% given the risky nature of short positions
- *During downtrends 📉 capital is allocated
- 20% to 30% of capital reserved for lowering cost basis if price declines while Market Signal trend persists
- During uptrends 📈 this tranche is allocated to
QQQI(ETF designed to capture NASDAQ-100 upside, while generating income through covered calls) to maintain market exposure with reduced volatility relative to TQQQ - During downtrends 📉 this tranche is allocated
TBIL(ETF providing exposure to the current US 3 Month Treasury Bill) - This tranche is reallocated to the corresponding 3× ETF if its price declines while Market Signal trend persists to lower cost basis (example)
- During uptrends 📈 this tranche is allocated to
- Any remaining capital is allocated to
TBILas a hedge - Actively manage downside risk by profit-taking at predefined thresholds (to lock in returns), and setting incrementally higher stop-loss orders
While managing risk and taking profit remains up to the investor, this approach has turned a profit while avoiding significant losses since Nov. 2, 2023.
Example
The following table contains the Market Signal, trend count, closing prices, and returns for QQQ and TQQQ during the 55 day uptrend from Mon. May 6 2024 through Thu. July 25 2024.
The uptrend's peak occurred on Wed. July 10 2024 - TQQQ closed at $84.93, a +45.03% gain since the trend started.
The Market Signal turned negative on Thu. July 25 2024, concluding the uptrend, and indicating to entirely exit long TQQQ positions (see above 'in cash during downtrends').
| A | B | C | D | E | F | G | |
|---|---|---|---|---|---|---|---|
|
1
|
Market Signal | Trend Count | QQQ Close | QQQ %chg since 📈1 | TQQQ close | TQQQ %chg since 📈1 | Date |
|
2
|
1 | 📈1 | $440.25 | 0.00% | $58.56 | 0.00% | Mon 5/6/24 |
|
3
|
3 | 📈2 | $440.32 | 0.02% | $58.56 | 0.00% | Tue 5/7/24 |
|
4
|
3 | 📈3 | $440.06 | -0.04% | $58.45 | -0.19% | Wed 5/8/24 |
|
5
|
3 | 📈4 | $441.02 | 0.17% | $58.77 | 0.36% | Thu 5/9/24 |
|
6
|
7 | 📈5 | $442.06 | 0.41% | $59.17 | 1.04% | Fri 5/10/24 |
|
7
|
7 | 📈6 | $443.08 | 0.64% | $59.56 | 1.71% | Mon 5/13/24 |
|
8
|
7 | 📈7 | $445.93 | 1.29% | $60.67 | 3.60% | Tue 5/14/24 |
|
9
|
8 | 📈8 | $452.90 | 2.87% | $63.47 | 8.38% | Wed 5/15/24 |
|
10
|
7 | 📈9 | $451.98 | 2.66% | $63.08 | 7.72% | Thu 5/16/24 |
|
11
|
7 | 📈10 | $451.76 | 2.61% | $62.94 | 7.48% | Fri 5/17/24 |
|
12
|
8 | 📈11 | $454.91 | 3.33% | $64.24 | 9.70% | Mon 5/20/24 |
|
13
|
8 | 📈12 | $455.80 | 3.53% | $64.57 | 10.26% | Tue 5/21/24 |
|
14
|
8 | 📈13 | $455.71 | 3.51% | $64.53 | 10.19% | Wed 5/22/24 |
|
15
|
7 | 📈14 | $453.66 | 3.05% | $63.57 | 8.56% | Thu 5/23/24 |
|
16
|
7 | 📈15 | $457.95 | 4.02% | $65.35 | 11.59% | Fri 5/24/24 |
|
17
|
7 | 📈16 | $459.68 | 4.41% | $66.06 | 12.81% | Tue 5/28/24 |
|
18
|
7 | 📈17 | $456.44 | 3.68% | $64.68 | 10.45% | Wed 5/29/24 |
|
19
|
6 | 📈18 | $451.55 | 2.57% | $62.60 | 6.90% | Thu 5/30/24 |
|
20
|
6 | 📈19 | $450.71 | 2.38% | $62.53 | 6.78% | Fri 5/31/24 |
|
21
|
6 | 📈20 | $453.13 | 2.93% | $63.14 | 7.82% | Mon 6/3/24 |
|
22
|
6 | 📈21 | $454.37 | 3.21% | $63.61 | 8.62% | Tue 6/4/24 |
|
23
|
8 | 📈22 | $463.53 | 5.29% | $67.45 | 15.18% | Wed 6/5/24 |
|
24
|
7 | 📈23 | $463.25 | 5.22% | $67.37 | 15.04% | Thu 6/6/24 |
|
25
|
7 | 📈24 | $462.96 | 5.16% | $67.12 | 14.62% | Fri 6/7/24 |
|
26
|
8 | 📈25 | $464.83 | 5.58% | $67.83 | 15.83% | Mon 6/10/24 |
|
27
|
8 | 📈26 | $468.02 | 6.31% | $69.23 | 18.22% | Tue 6/11/24 |
|
28
|
8 | 📈27 | $474.15 | 7.70% | $71.96 | 22.88% | Wed 6/12/24 |
|
29
|
7 | 📈28 | $476.72 | 8.28% | $73.11 | 24.85% | Thu 6/13/24 |
|
30
|
7 | 📈29 | $479.19 | 8.84% | $74.17 | 26.66% | Fri 6/14/24 |
|
31
|
8 | 📈30 | $485.06 | 10.18% | $76.86 | 31.25% | Mon 6/17/24 |
|
32
|
8 | 📈31 | $485.21 | 10.21% | $76.90 | 31.32% | Tue 6/18/24 |
|
33
|
7 | 📈32 | $481.47 | 9.36% | $75.09 | 28.23% | Thu 6/20/24 |
|
34
|
7 | 📈33 | $480.18 | 9.07% | $74.40 | 27.05% | Fri 6/21/24 |
|
35
|
6 | 📈34 | $473.96 | 7.66% | $71.88 | 22.75% | Mon 6/24/24 |
|
36
|
7 | 📈35 | $479.68 | 8.96% | $74.28 | 26.84% | Tue 6/25/24 |
|
37
|
7 | 📈36 | $480.47 | 9.14% | $74.46 | 27.15% | Wed 6/26/24 |
|
38
|
7 | 📈37 | $481.61 | 9.39% | $75.00 | 28.07% | Thu 6/27/24 |
|
39
|
7 | 📈38 | $479.11 | 8.83% | $73.82 | 26.06% | Fri 6/28/24 |
|
40
|
7 | 📈39 | $481.92 | 9.47% | $75.03 | 28.13% | Mon 7/1/24 |
|
41
|
7 | 📈40 | $486.98 | 10.61% | $77.33 | 32.05% | Tue 7/2/24 |
|
42
|
7 | 📈41 | $491.04 | 11.54% | $79.23 | 35.30% | Wed 7/3/24 |
|
43
|
8 | 📈42 | $496.16 | 12.70% | $81.63 | 39.40% | Fri 7/5/24 |
|
44
|
7 | 📈43 | $497.34 | 12.97% | $82.17 | 40.32% | Mon 7/8/24 |
|
45
|
7 | 📈44 | $497.77 | 13.07% | $82.35 | 40.63% | Tue 7/9/24 |
|
46
|
8 | 📈45 | $502.96 | 14.24% | $84.93 | 45.03% | Wed 7/10/24 |
|
47
|
7 | 📈46 | $491.93 | 11.74% | $79.35 | 35.50% | Thu 7/11/24 |
|
48
|
7 | 📈47 | $494.82 | 12.40% | $80.64 | 37.70% | Fri 7/12/24 |
|
49
|
7 | 📈48 | $496.15 | 12.70% | $81.24 | 38.73% | Mon 7/15/24 |
|
50
|
8 | 📈49 | $496.34 | 12.74% | $81.30 | 38.83% | Tue 7/16/24 |
|
51
|
6 | 📈50 | $481.77 | 9.43% | $74.15 | 38.83% | Wed 7/17/24 |
|
52
|
5 | 📈51 | $479.49 | 8.91% | $73.04 | 24.73% | Thu 7/18/24 |
|
53
|
5 | 📈52 | $475.24 | 7.95% | $71.06 | 21.35% | Fri 7/19/24 |
|
54
|
5 | 📈53 | $482.32 | 9.56% | $74.16 | 26.64% | Mon 7/22/24 |
|
55
|
5 | 📈54 | $480.62 | 9.17% | $73.36 | 25.27% | Tue 7/23/24 |
|
56
|
4 | 📈55 | $463.38 | 5.25% | $65.45 | 11.77% | Wed 7/24/24 |
|
57
|
-2 | 📉1 | $458.27 | 4.09% | $63.27 | 8.04% | Thu 7/25/24 |
For a TQQQ position opened after market close on the first day of the uptrend, and held until the Market Signal went negative, the following exit opportunities occurred:
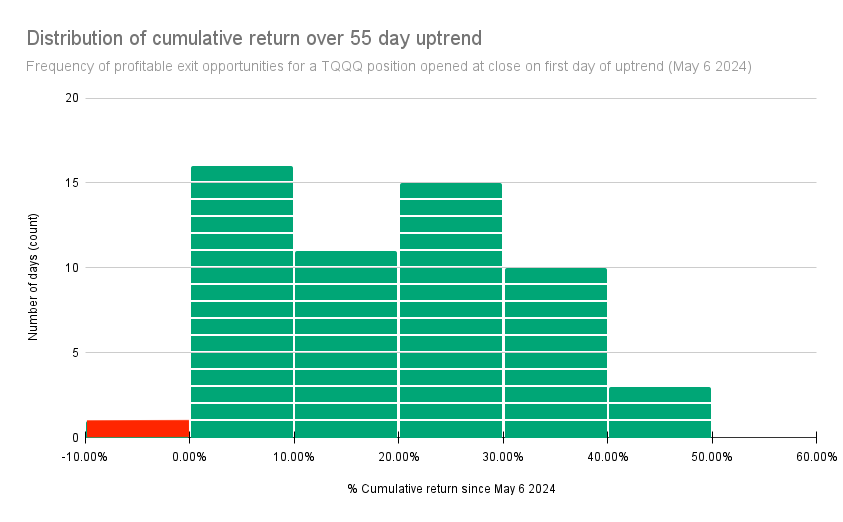
- Only 1 day with negative cumulative return
- 39 days (or 69.64% of the uptrend) having cumulative return greater than +10%
- 11 days with
TQQQclosing between+10%and+20%gain - 15 days with
TQQQclosing between+20%and+30%gain - 13 days with
TQQQclosing over+30%gain
- 11 days with
Disclaimer: The information that Raincheck Fund provides is general in nature as it has been prepared without taking account of your objectives, financial situation or needs. It is not intended as legal, financial or investment advice and should not be construed or relied on as such. Raincheck Fund is for information purposes only. Raincheck Fund is not responsible for any damages or losses that may occur as a result of reliance on this information. Before making any commitment of a legal or financial nature you should seek advice from a qualified and registered legal practitioner or financial or investment adviser.
All content, group, messaging, tweets, newsletter, article, and email created by Raincheck Fund is intended for educational and information purposes only, is not financial, investment, legal or tax advice, and is a restatement, summary or extract of other data and research reports that are widely distributed and publicly available. Raincheck Fund is not a registered financial, investment, legal or tax advisor and is not liable for any financial loss you may incur acting on any information provided by Raincheck Fund.
Investment advice provided solely by Autopilot advisers LLC, an SEC registered investment advisor. Past performance does not guarantee future results. Investing carries risks, including the risk of the loss of principal.
Investing in securities involves significant risk, including the risk of loss of principal. Past performance does not guarantee future results, and there can be no assurance that any investment strategy or security will meet its objectives or achieve any specific financial outcome. You should only invest risk capital that you can afford to lose without impacting your financial stability. Carefully consider your individual financial situation, investment goals, and risk tolerance before making any investment decisions.