Sep. 5th 2025
Cautious optimism
Market Signal: +7 STRONG BULLISH
The Market Signal is back in STRONG BULLISH range, and the NASDAQ-100 (QQQ) is again within spitting distance of all-time highs.
Friday's action saw QQQ gap up to open, followed by selling pressure on above average volume. Notwithstanding, the index closed up from the prior day, and more importantly closed above the consolidation range. Holding above this level would be a bullish indication.
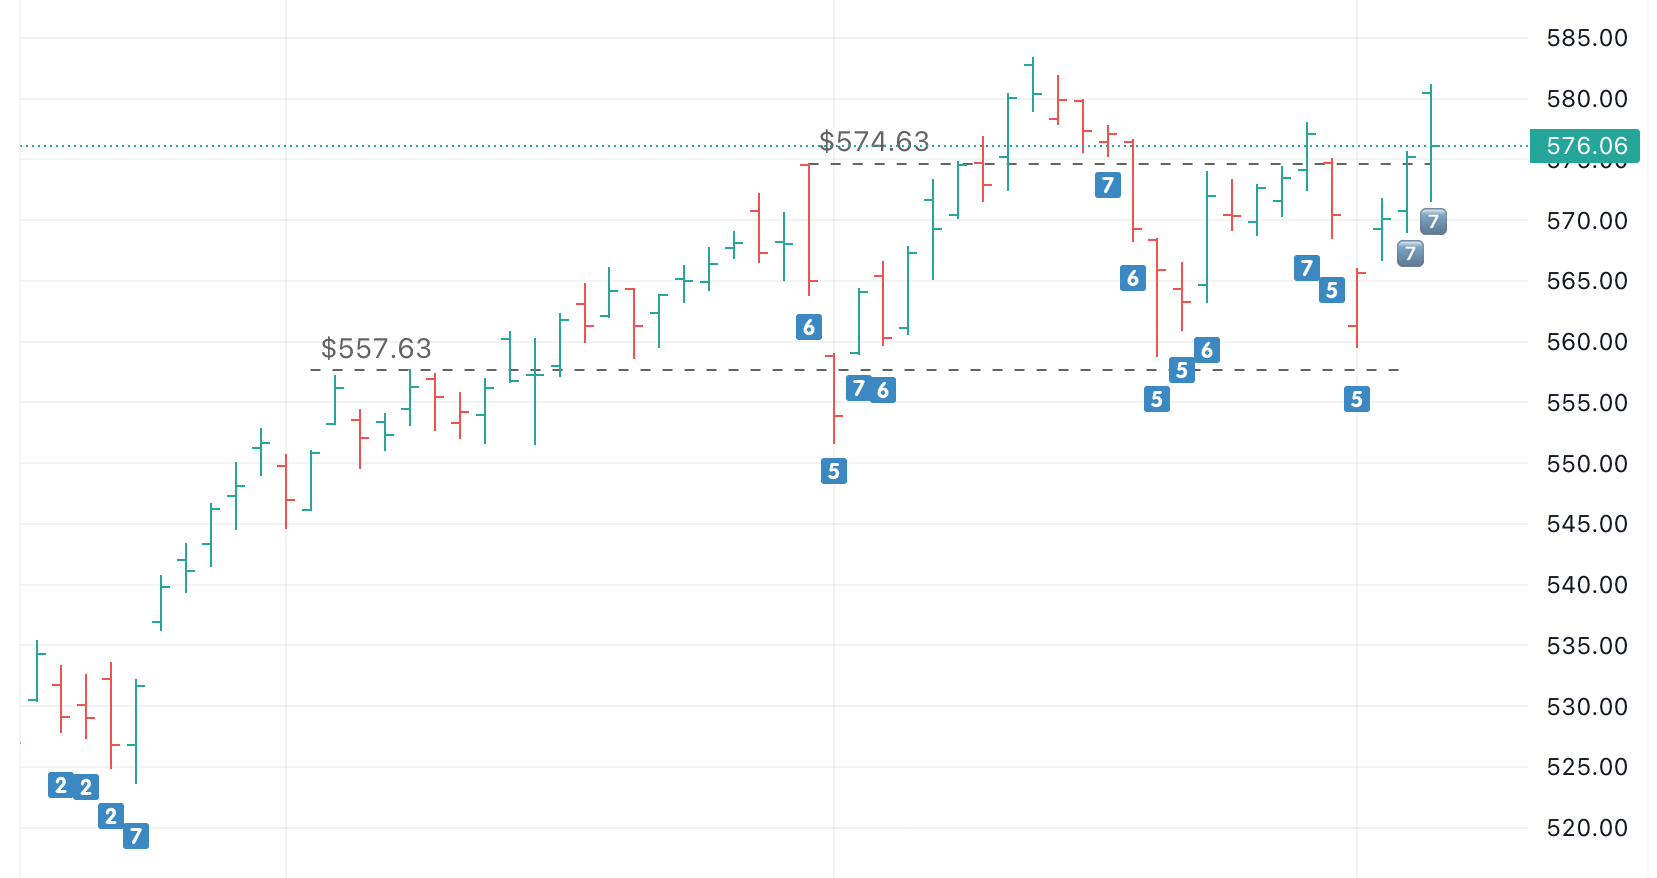
STRONG BULLISH range and QQQ is within 1% of all-time highsOn the other hand, Friday marked back-to-back bleak jobs reports. The labor market is loosening and now has more unemployed people than job openings.
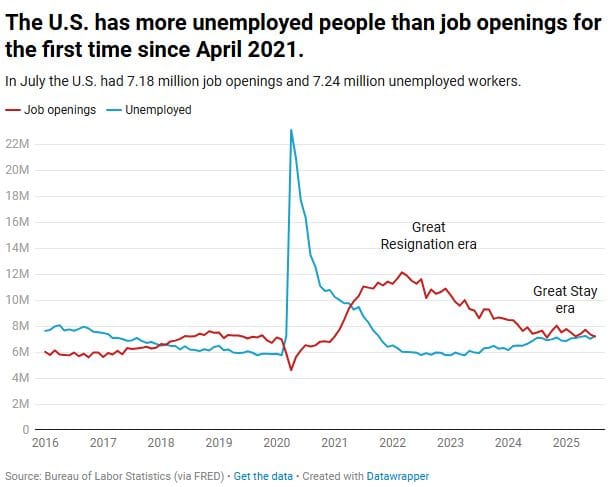
However, one must remember that while the stock market is often used as a proxy for economic health, it is not the economy itself. For example, during the COVID-19 pandemic the stock market thrived despite a severe downturn in the real economy.
The next Federal Reserve interest rate decision is due on Wed. September 17th 2025 at 2:00 PM ET.
NASDAQ-100 52-week highs
The following NASDAQ-100 (QQQ) holdings closed at a 52-week high today:
GOOG $235.17 +1.08%GOOGL $235.00 +1.16%AVGO $334.89 +9.41%MU $131.37 +5.76%ADSK $326.37 +2.01%
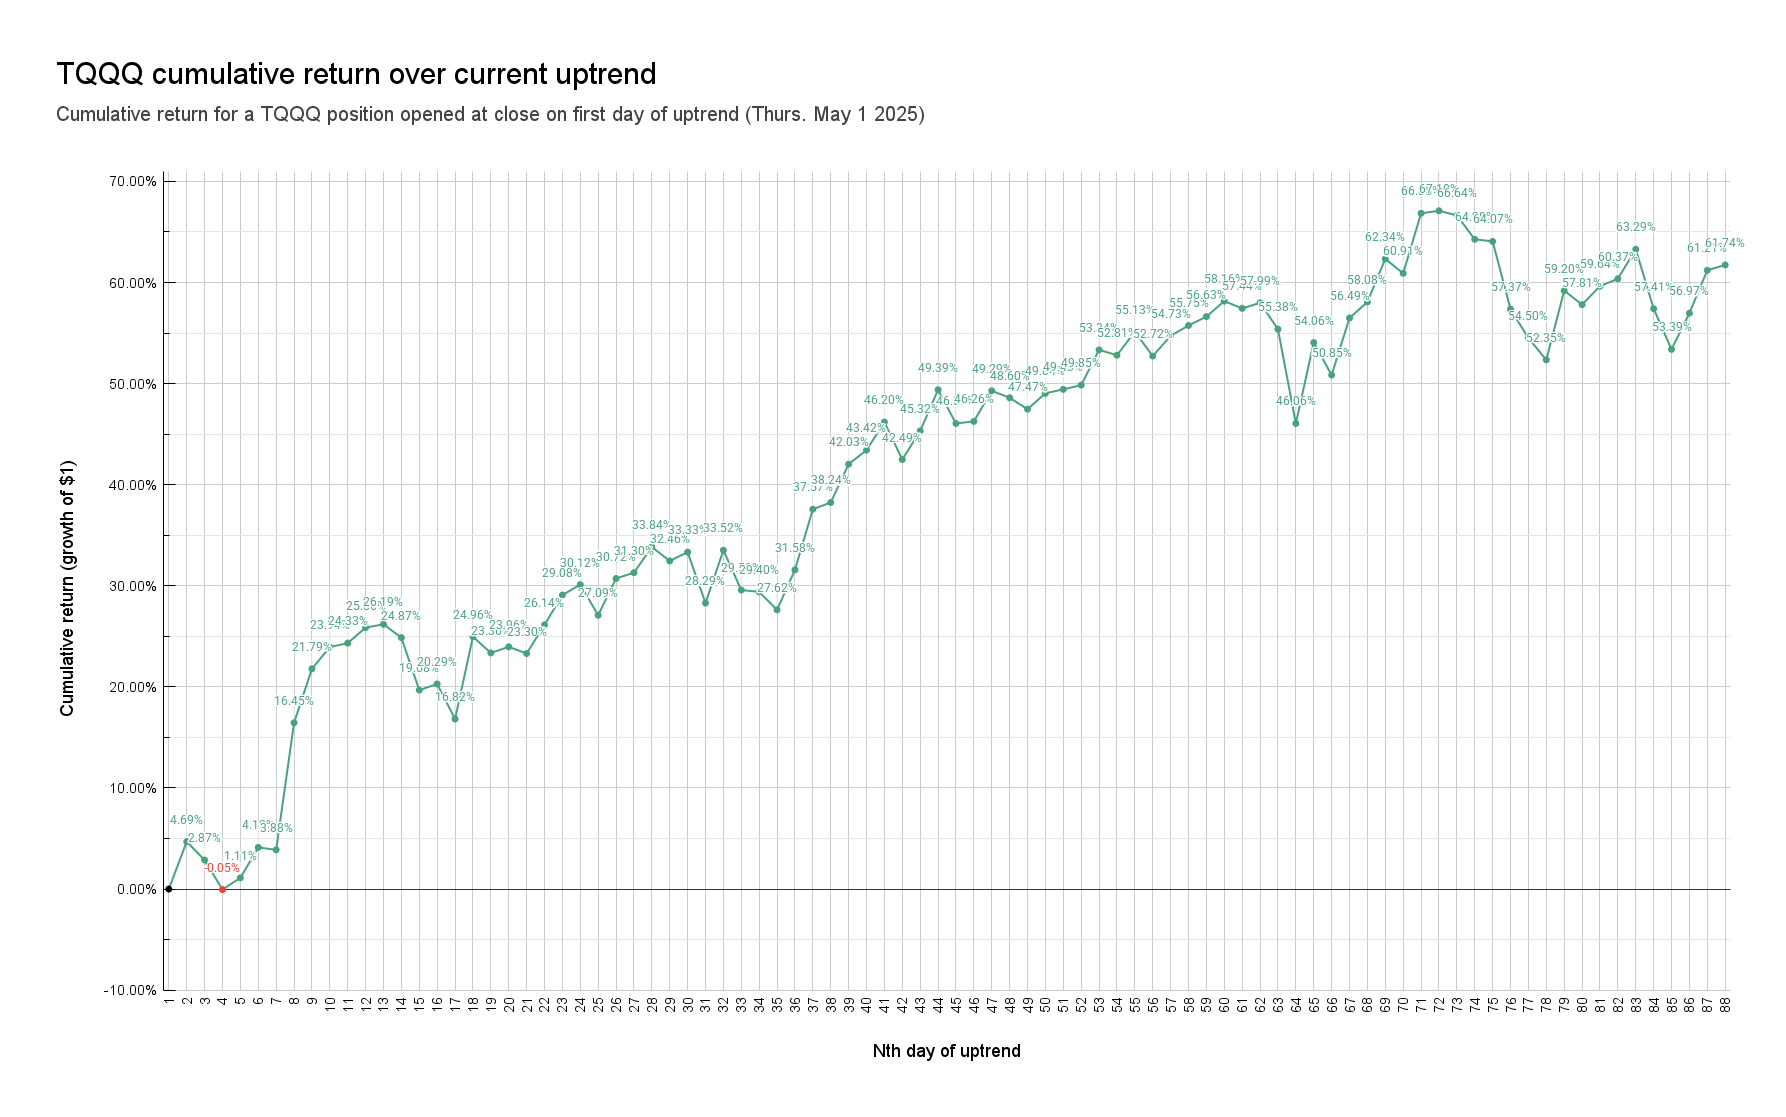
📈88th day of uptrend
Day 📈1 of current uptrend occurred on Thurs. May 1st 2025.
QQQ+19.59% since start of current uptrendTQQQ+61.74% since start of current uptrend
| A | B | C | D | E | F | G | |
|---|---|---|---|---|---|---|---|
|
1
|
Market Signal | Trend Count | QQQ Close | QQQ %chg since 📈1 | TQQQ close | TQQQ %chg since 📈1 | Date |
|
2
|
2 | 📈1 | $481.68 | 0.00% | $56.77 | 0.00% | Thu 5/1/25 |
|
3
|
2 | 📈2 | $488.83 | 1.48% | $59.43 | 4.69% | Fri 5/2/25 |
|
4
|
2 | 📈3 | $485.93 | 0.88% | $58.40 | 2.87% | Mon 5/5/25 |
|
5
|
2 | 📈4 | $481.41 | -0.06% | $56.74 | -0.05% | Tue 5/6/25 |
|
6
|
2 | 📈5 | $483.30 | 0.34% | $57.40 | 1.11% | Wed 5/7/25 |
|
7
|
2 | 📈6 | $488.29 | 1.37% | $59.11 | 4.12% | Thu 5/8/25 |
|
8
|
2 | 📈7 | $487.97 | 1.31% | $58.97 | 3.88% | Fri 5/9/25 |
|
9
|
3 | 📈8 | $507.85 | 5.43% | $66.11 | 16.45% | Mon 5/12/25 |
|
10
|
3 | 📈9 | $515.59 | 7.04% | $69.14 | 21.79% | Tue 5/13/25 |
|
11
|
3 | 📈10 | $518.68 | 7.68% | $70.36 | 23.94% | Wed 5/14/25 |
|
12
|
3 | 📈11 | $519.25 | 7.80% | $70.58 | 24.33% | Thu 5/15/25 |
|
13
|
3 | 📈12 | $521.51 | 8.27% | $71.45 | 25.86% | Fri 5/16/25 |
|
14
|
3 | 📈13 | $522.01 | 8.37% | $71.64 | 26.19% | Mon 5/19/25 |
|
15
|
3 | 📈14 | $520.27 | 8.01% | $70.89 | 24.87% | Tue 5/20/25 |
|
16
|
3 | 📈15 | $513.04 | 6.51% | $67.94 | 19.68% | Wed 5/21/25 |
|
17
|
2 | 📈16 | $514.00 | 6.71% | $68.29 | 20.29% | Thu 5/22/25 |
|
18
|
2 | 📈17 | $509.24 | 5.72% | $66.32 | 16.82% | Fri 5/23/25 |
|
19
|
4 | 📈18 | $521.22 | 8.21% | $70.94 | 24.96% | Tue 5/27/25 |
|
20
|
3 | 📈19 | $518.91 | 7.73% | $70.03 | 23.36% | Wed 5/28/25 |
|
21
|
3 | 📈20 | $519.93 | 7.94% | $70.37 | 23.96% | Thu 5/29/25 |
|
22
|
3 | 📈21 | $519.11 | 7.77% | $70.00 | 23.30% | Fri 5/30/25 |
|
23
|
4 | 📈22 | $523.21 | 8.62% | $71.61 | 26.14% | Mon 6/2/25 |
|
24
|
4 | 📈23 | $527.30 | 9.47% | $73.28 | 29.08% | Tue 6/3/25 |
|
25
|
3 | 📈24 | $528.77 | 9.78% | $73.87 | 30.12% | Wed 6/4/25 |
|
26
|
3 | 📈25 | $524.79 | 8.95% | $72.15 | 27.09% | Thu 6/5/25 |
|
27
|
4 | 📈26 | $529.92 | 10.01% | $74.21 | 30.72% | Fri 6/6/25 |
|
28
|
3 | 📈27 | $530.70 | 10.18% | $74.54 | 31.30% | Mon 6/9/25 |
|
29
|
3 | 📈28 | $534.21 | 10.91% | $75.98 | 33.84% | Tue 6/10/25 |
|
30
|
3 | 📈29 | $532.41 | 10.53% | $75.20 | 32.46% | Wed 6/11/25 |
|
31
|
3 | 📈30 | $533.66 | 10.79% | $75.69 | 33.33% | Thu 6/12/25 |
|
32
|
2 | 📈31 | $526.96 | 9.40% | $72.83 | 28.29% | Fri 6/13/25 |
|
33
|
3 | 📈32 | $534.29 | 10.92% | $75.80 | 33.52% | Mon 6/16/25 |
|
34
|
2 | 📈33 | $529.08 | 9.84% | $73.56 | 29.58% | Tue 6/17/25 |
|
35
|
2 | 📈34 | $528.99 | 9.82% | $73.46 | 29.40% | Wed 6/18/25 |
|
36
|
2 | 📈35 | $526.83 | 9.37% | $72.45 | 27.62% | Fri 6/20/25 |
|
37
|
7 | 📈36 | $531.65 | 10.37% | $74.70 | 31.58% | Mon 6/23/25 |
|
38
|
7 | 📈37 | $539.78 | 12.06% | $78.10 | 37.57% | Tue 6/24/25 |
|
39
|
7 | 📈38 | $541.16 | 12.35% | $78.48 | 38.24% | Wed 6/25/25 |
|
40
|
8 | 📈39 | $546.22 | 13.40% | $80.63 | 42.03% | Thu 6/26/25 |
|
41
|
7 | 📈40 | $548.09 | 13.79% | $81.42 | 43.42% | Fri 6/27/25 |
|
42
|
8 | 📈41 | $551.64 | 14.52% | $83.00 | 46.20% | Mon 6/30/25 |
|
43
|
7 | 📈42 | $546.99 | 13.56% | $80.89 | 42.49% | Tue 7/1/25 |
|
44
|
7 | 📈43 | $550.80 | 14.35% | $82.50 | 45.32% | Wed 7/2/25 |
|
45
|
8 | 📈44 | $556.22 | 15.48% | $84.81 | 49.39% | Thu 7/3/25 |
|
46
|
7 | 📈45 | $552.03 | 14.61% | $82.92 | 46.06% | Mon 7/7/25 |
|
47
|
7 | 📈46 | $552.34 | 14.67% | $83.03 | 46.26% | Tue 7/8/25 |
|
48
|
7 | 📈47 | $556.25 | 15.48% | $84.75 | 49.29% | Wed 7/9/25 |
|
49
|
7 | 📈48 | $555.45 | 15.32% | $84.36 | 48.60% | Thu 7/10/25 |
|
50
|
7 | 📈49 | $554.20 | 15.06% | $83.72 | 47.47% | Fri 7/11/25 |
|
51
|
7 | 📈50 | $556.21 | 15.47% | $84.61 | 49.04% | Mon 7/14/25 |
|
52
|
7 | 📈51 | $556.72 | 15.58% | $84.83 | 49.43% | Tue 7/15/25 |
|
53
|
7 | 📈52 | $557.29 | 15.70% | $85.07 | 49.85% | Wed 7/16/25 |
|
54
|
7 | 📈53 | $561.80 | 16.63% | $87.05 | 53.34% | Thu 7/17/25 |
|
55
|
7 | 📈54 | $561.26 | 16.52% | $86.75 | 52.81% | Fri 7/18/25 |
|
56
|
7 | 📈55 | $564.17 | 17.13% | $88.07 | 55.13% | Mon 7/21/25 |
|
57
|
7 | 📈56 | $561.25 | 16.52% | $86.70 | 52.72% | Tue 7/22/25 |
|
58
|
7 | 📈57 | $563.81 | 17.05% | $87.84 | 54.73% | Wed 7/23/25 |
|
59
|
7 | 📈58 | $565.01 | 17.30% | $88.42 | 55.75% | Thu 7/24/25 |
|
60
|
7 | 📈59 | $566.37 | 17.58% | $88.92 | 56.63% | Fri 7/25/25 |
|
61
|
7 | 📈60 | $568.14 | 17.95% | $89.79 | 58.16% | Mon 7/28/25 |
|
62
|
7 | 📈61 | $567.26 | 17.77% | $89.38 | 57.44% | Tue 7/29/25 |
|
63
|
7 | 📈62 | $568.02 | 17.92% | $89.69 | 57.99% | Wed 7/30/25 |
|
64
|
6 | 📈63 | $565.01 | 17.30% | $88.21 | 55.38% | Thu 7/31/25 |
|
65
|
5 | 📈64 | $553.88 | 14.99% | $82.92 | 46.06% | Fri 8/1/25 |
|
66
|
7 | 📈65 | $564.10 | 17.11% | $87.46 | 54.06% | Mon 8/4/25 |
|
67
|
6 | 📈66 | $560.27 | 16.32% | $85.64 | 50.85% | Tue 8/5/25 |
|
68
|
7 | 📈67 | $567.32 | 17.78% | $88.84 | 56.49% | Wed 8/6/25 |
|
69
|
7 | 📈68 | $569.24 | 18.18% | $89.74 | 58.08% | Thu 8/7/25 |
|
70
|
7 | 📈69 | $574.55 | 19.28% | $92.16 | 62.34% | Fri 8/8/25 |
|
71
|
7 | 📈70 | $572.85 | 18.93% | $91.35 | 60.91% | Mon 8/11/25 |
|
72
|
7 | 📈71 | $580.05 | 20.42% | $94.72 | 66.85% | Tue 8/12/25 |
|
73
|
7 | 📈72 | $580.34 | 20.48% | $94.86 | 67.10% | Wed 8/13/25 |
|
74
|
7 | 📈73 | $579.89 | 20.39% | $94.60 | 66.64% | Thu 8/14/25 |
|
75
|
7 | 📈74 | $577.34 | 19.86% | $93.26 | 64.28% | Fri 8/15/25 |
|
76
|
7 | 📈75 | $577.11 | 19.81% | $93.14 | 64.07% | Mon 8/18/25 |
|
77
|
6 | 📈76 | $569.28 | 18.19% | $89.34 | 57.37% | Tue 8/19/25 |
|
78
|
5 | 📈77 | $565.90 | 17.48% | $87.71 | 54.50% | Wed 8/20/25 |
|
79
|
5 | 📈78 | $563.28 | 16.94% | $86.49 | 52.35% | Thu 8/21/25 |
|
80
|
6 | 📈79 | $571.97 | 18.74% | $90.38 | 59.20% | Fri 8/22/25 |
|
81
|
6 | 📈80 | $570.32 | 18.40% | $89.59 | 57.81% | Mon 8/25/25 |
|
82
|
6 | 📈81 | $572.61 | 18.88% | $90.63 | 59.64% | Tue 8/26/25 |
|
83
|
7 | 📈82 | $573.49 | 19.06% | $91.04 | 60.37% | Wed 8/27/25 |
|
84
|
7 | 📈83 | $577.08 | 19.81% | $92.70 | 63.29% | Thu 8/28/25 |
|
85
|
5 | 📈84 | $570.40 | 18.42% | $89.36 | 57.41% | Fri 8/29/25 |
|
86
|
5 | 📈85 | $565.62 | 17.43% | $87.08 | 53.39% | Tue 9/2/25 |
|
87
|
6.5 | 📈86 | $570.07 | 18.35% | $89.11 | 56.97% | Wed 9/3/25 |
|
88
|
7 | 📈87 | $575.23 | 19.42% | $91.52 | 61.21% | Thu 9/4/25 |
|
89
|
7 | 📈88 | $576.06 | 19.59% | $91.82 | 61.74% | Fri 9/5/25 |
Market Signal, Trend Count, closing prices, and cumulative return (%) over current uptrend
TQQQ vs QQQ Holdings
TQQQ is outperforming 96% of QQQ holdings since day 📈1 of current uptrend (Thurs. May 1st 2025), including all of the Magnificent 7.
There is just a 4 in 100 (or 4%) chance of having picked NASDAQ-100 (QQQ) holdings that outperformed TQQQ over this timeframe. This kind of outperformance on TQQQ's part is a core tenet of Raincheck Fund's thesis.
AppLovin (APP), the second best performing stock over the current uptrend, was recently confirmed to join the S&P500.
| A | B | C | D | E | |
|---|---|---|---|---|---|
|
1
|
Market Cap | Symbol | %Chg since 📈1 | Close on 📈1 | Close |
|
2
|
366,806 M | QQQ | 19.59% | $481.68 | $576.06 |
|
3
|
26,420 M | MDB | 88.59% | $172.19 | $324.74 |
|
4
|
165,824 M | APP | 75.41% | $279.49 | $490.24 |
|
5
|
1,575,145 M | AVGO | 69.71% | $197.33 | $334.89 |
|
6
|
147,019 M | MU | 68.92% | $77.77 | $131.37 |
|
7
|
26,527 M | TQQQ | 61.74% | $56.77 | $91.82 |
|
8
|
245,277 M | AMD | 56.38% | $96.65 | $151.14 |
|
9
|
4,066,436 M | NVDA | 49.65% | $111.61 | $167.02 |
|
10
|
2,842,090 M | GOOGL | 45.69% | $161.30 | $235.00 |
|
11
|
2,844,146 M | GOOG | 44.46% | $162.79 | $235.17 |
|
12
|
29,982 M | WBD | 43.65% | $8.43 | $12.11 |
|
13
|
130,296 M | LRCX | 43.52% | $71.73 | $102.95 |
|
14
|
35,576 M | MCHP | 43.37% | $45.98 | $65.92 |
|
15
|
51,442 M | IDXX | 36.41% | $471.38 | $642.99 |
|
16
|
119,437 M | KLAC | 33.83% | $676.31 | $905.09 |
|
17
|
363,229 M | PLTR | 31.76% | $116.20 | $153.11 |
|
18
|
1,890,261 M | META | 31.50% | $572.21 | $752.45 |
|
19
|
110,682 M | SNPS | 30.21% | $459.36 | $598.14 |
|
20
|
47,457 M | DDOG | 27.99% | $106.32 | $136.08 |
|
21
|
121,547 M | ADI | 27.53% | $193.74 | $247.07 |
|
22
|
44,936 M | BKR | 25.95% | $36.19 | $45.58 |
|
23
|
105,453 M | DASH | 25.82% | $196.20 | $246.85 |
|
24
|
94,215 M | CEG | 25.34% | $240.62 | $301.58 |
|
25
|
1,131,616 M | TSLA | 25.07% | $280.52 | $350.84 |
|
26
|
57,164 M | NXPI | 24.69% | $181.84 | $226.74 |
|
27
|
20,083 M | ON | 24.00% | $39.60 | $49.11 |
|
28
|
107,192 M | INTC | 22.57% | $19.98 | $24.49 |
|
29
|
2,477,779 M | AMZN | 22.15% | $190.20 | $232.33 |
|
30
|
42,692 M | ZS | 20.76% | $227.06 | $274.20 |
|
31
|
146,359 M | ARM | 19.73% | $115.40 | $138.17 |
|
32
|
69,517 M | ADSK | 19.34% | $273.49 | $326.37 |
|
33
|
55,075 M | FAST | 18.92% | $40.35 | $47.99 |
|
34
|
170,854 M | TXN | 18.75% | $158.26 | $187.93 |
|
35
|
172,467 M | QCOM | 18.22% | $135.21 | $159.84 |
|
36
|
177,002 M | PDD | 17.66% | $105.97 | $124.68 |
|
37
|
57,183 M | AXON | 17.28% | $621.10 | $728.41 |
|
38
|
307,365 M | ASML | 17.25% | $666.72 | $781.70 |
|
39
|
95,647 M | CDNS | 17.11% | $299.73 | $351.01 |
|
40
|
32,907 M | ANSS | 17.07% | $319.73 | $374.30 |
|
41
|
37,900 M | CSGP | 16.82% | $76.58 | $89.46 |
|
42
|
3,679,417 M | MSFT | 16.36% | $425.40 | $495.00 |
|
43
|
20,624 M | BIIB | 16.32% | $120.93 | $140.67 |
|
44
|
42,190 M | EA | 16.21% | $145.10 | $168.62 |
|
45
|
253,311 M | AZN | 15.87% | $70.51 | $81.70 |
|
46
|
60,645 M | CSX | 15.72% | $28.11 | $32.53 |
|
47
|
264,469 M | CSCO | 15.11% | $58.12 | $66.90 |
|
48
|
31,572 M | DXCM | 14.59% | $70.26 | $80.51 |
|
49
|
3,557,093 M | AAPL | 12.36% | $213.32 | $239.69 |
|
50
|
34,575 M | GEHC | 11.91% | $67.67 | $75.73 |
|
51
|
88,956 M | ORLY | 11.72% | $93.85 | $104.84 |
|
52
|
142,755 M | GILD | 11.43% | $103.25 | $115.05 |
|
53
|
52,011 M | PCAR | 10.33% | $89.78 | $99.05 |
|
54
|
528,532 M | NFLX | 9.74% | $1,133.47 | $1,243.82 |
|
55
|
200,419 M | PEP | 9.61% | $133.55 | $146.39 |
|
56
|
129,654 M | AMAT | 9.26% | $148.96 | $162.75 |
|
57
|
49,371 M | ROST | 8.65% | $138.93 | $150.95 |
|
58
|
71,855 M | MAR | 8.51% | $243.95 | $264.70 |
|
59
|
187,586 M | INTU | 7.96% | $623.19 | $672.82 |
|
60
|
178,442 M | BKNG | 7.93% | $5,101.43 | $5,505.80 |
|
61
|
122,560 M | MELI | 5.36% | $2,294.52 | $2,417.49 |
|
62
|
60,988 M | MNST | 4.94% | $59.52 | $62.46 |
|
63
|
220,162 M | LIN | 4.79% | $448.05 | $469.52 |
|
64
|
22,245 M | CDW | 4.51% | $162.40 | $169.73 |
|
65
|
130,074 M | PANW | 4.40% | $186.27 | $194.46 |
|
66
|
65,214 M | PYPL | 4.36% | $65.41 | $68.26 |
|
67
|
97,108 M | SBUX | 4.17% | $82.01 | $85.43 |
|
68
|
54,597 M | MRVL | 3.90% | $60.95 | $63.33 |
|
69
|
42,985 M | XEL | 3.24% | $70.40 | $72.68 |
|
70
|
40,155 M | FANG | 2.88% | $134.83 | $138.71 |
|
71
|
284,461 M | TMUS | 2.33% | $247.00 | $252.76 |
|
72
|
44,214 M | TTWO | 1.92% | $235.17 | $239.68 |
|
73
|
136,027 M | HON | 1.67% | $210.74 | $214.25 |
|
74
|
57,817 M | AEP | 0.53% | $107.54 | $108.11 |
|
75
|
125,203 M | CMCSA | 0.27% | $33.82 | $33.91 |
|
76
|
31,674 M | ODFL | 0.10% | $150.56 | $150.71 |
|
77
|
152,701 M | AMGN | -0.05% | $283.78 | $283.64 |
|
78
|
75,801 M | ABNB | -0.16% | $124.01 | $123.81 |
|
79
|
40,391 M | CCEP | -0.74% | $89.54 | $88.88 |
|
80
|
119,881 M | ADP | -0.91% | $298.69 | $295.97 |
|
81
|
25,459 M | TTD | -1.87% | $53.06 | $52.07 |
|
82
|
82,409 M | CTAS | -2.41% | $209.55 | $204.50 |
|
83
|
60,771 M | REGN | -2.82% | $590.00 | $573.38 |
|
84
|
104,806 M | CRWD | -3.30% | $431.88 | $417.63 |
|
85
|
427,281 M | COST | -3.56% | $999.04 | $963.48 |
|
86
|
32,300 M | KHC | -4.25% | $28.50 | $27.29 |
|
87
|
35,077 M | CTSH | -4.53% | $75.23 | $71.82 |
|
88
|
18,475 M | GFS | -5.37% | $35.18 | $33.29 |
|
89
|
61,698 M | WDAY | -6.30% | $246.61 | $231.08 |
|
90
|
43,864 M | EXC | -6.80% | $46.60 | $43.43 |
|
91
|
148,033 M | ADBE | -6.85% | $374.63 | $348.97 |
|
92
|
55,791 M | ROP | -7.02% | $557.59 | $518.44 |
|
93
|
48,705 M | PAYX | -7.62% | $146.61 | $135.44 |
|
94
|
37,766 M | VRSK | -8.22% | $294.51 | $270.31 |
|
95
|
79,888 M | MDLZ | -9.03% | $67.87 | $61.74 |
|
96
|
167,358 M | ISRG | -9.73% | $517.18 | $466.86 |
|
97
|
95,237 M | MSTR | -11.98% | $381.60 | $335.87 |
|
98
|
38,919 M | KDP | -15.83% | $34.04 | $28.65 |
|
99
|
46,964 M | CPRT | -19.72% | $60.50 | $48.57 |
|
100
|
101,561 M | VRTX | -20.59% | $498.86 | $396.12 |
|
101
|
60,405 M | FTNT | -24.35% | $104.21 | $78.83 |
|
102
|
45,234 M | TEAM | -24.73% | $229.07 | $172.43 |
|
103
|
35,719 M | CHTR | -31.72% | $383.00 | $261.50 |
|
104
|
20,110 M | LULU | -37.53% | $268.60 | $167.80 |
Assuming 3% for the risk-free rate, the Sharpe Ratio for this investment is 3.43.
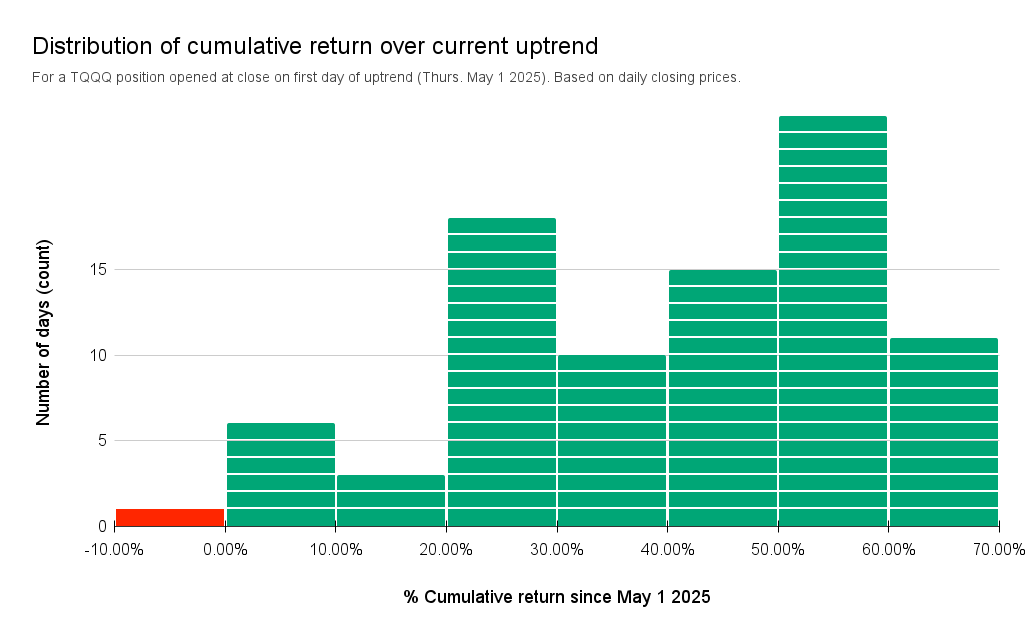
For a TQQQ position opened at close on day 📈1 of current uptrend (Thurs. May 1st 2025):
- Up +50% or more for 35 days, or 39.77% of the current uptrend.
- Up +30% or more for 60 days, or 68.18% of the current uptrend
- In the red (-0.05%) for just 1 day, or 1.14% of the current uptrend