Oct. 10th 2025
QQQ sees worst day in 6 months
Market Signal: +5 MODERATE BULLISH
On Friday, the NASDAQ-100 (QQQ) was trading at all-time highs before closing down -3.47% - its worst day since Thurs. Apr. 10th 2025.
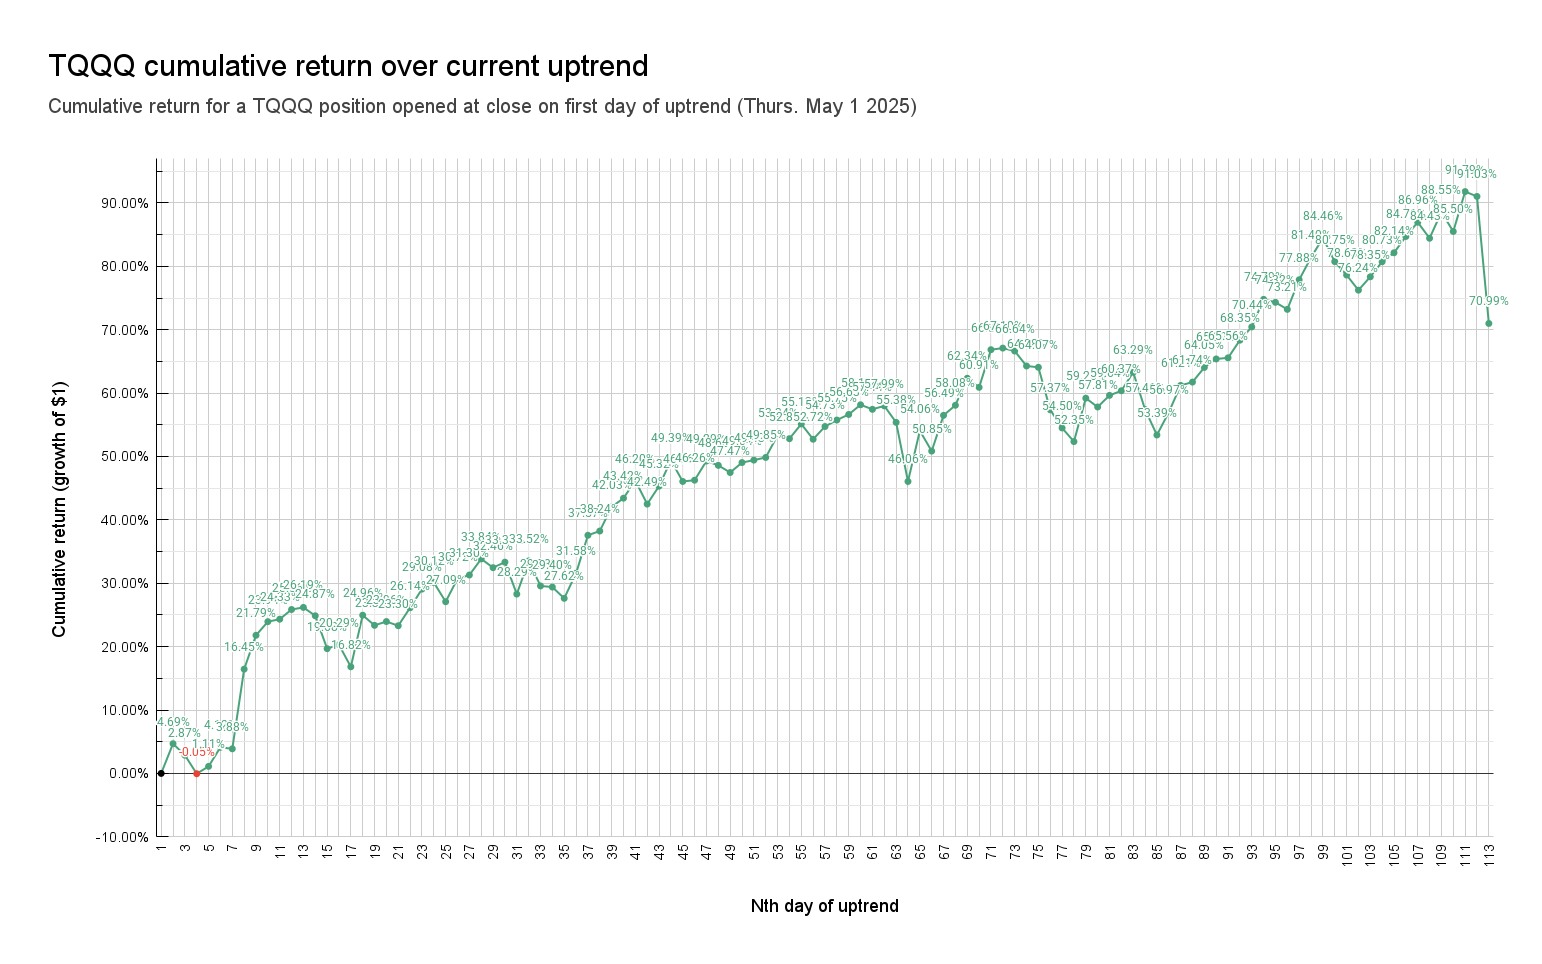
TQQQ fell -10.49%. TQQQ lost $11.38, shedding 20% of it's value from day 📈1 of current uptrend (see cumulative return graph).
Friday was objectively a bad day - just a few other days in the trailing year have seen QQQ fall by 3% or more:
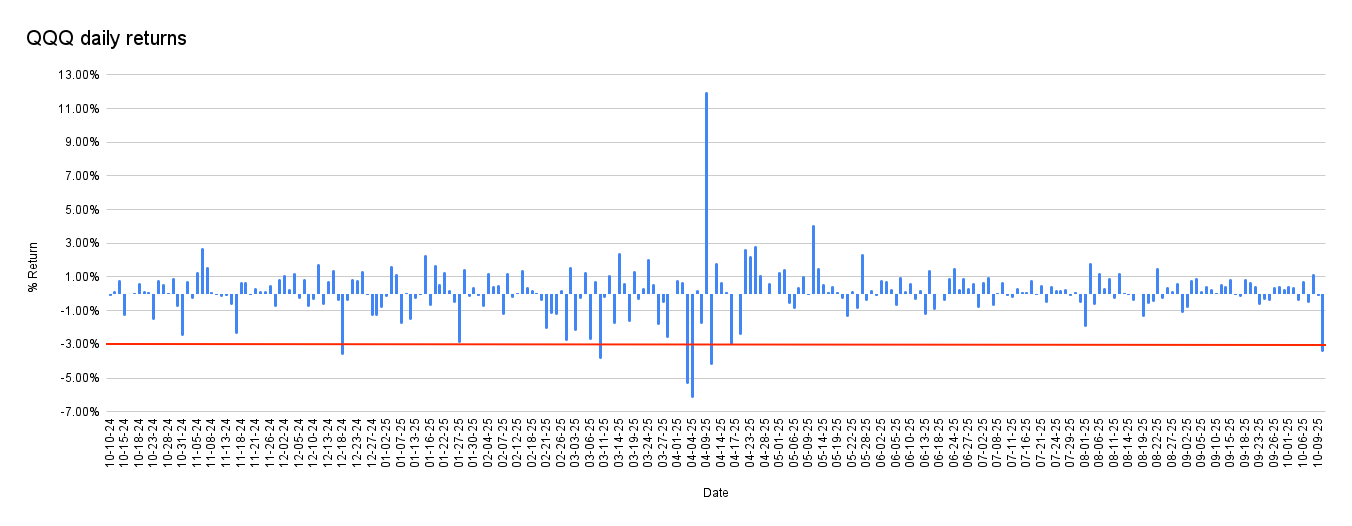
QQQ has fallen by more than 3% only 6 times in the trailing yearThe last time QQQ fell by 3% or more during an uptrend was almost a year ago on Wed. Dec. 18th 2024.
QQQ dropped all the way to the bottom of the range mentioned the past two weeks.
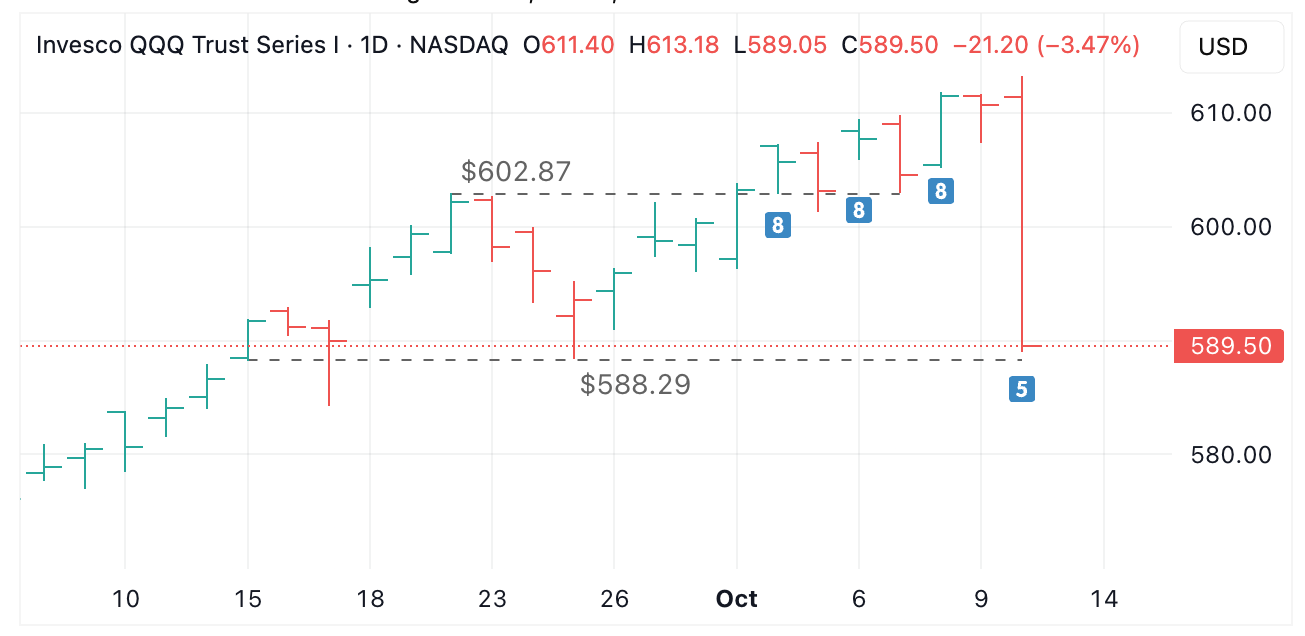
The uptrend is technically ongoing as the Market Signal remains positive, but it has greatly weakened and potentially at-risk.
This uptrend is the longest on record since Raincheck Fund's inception. It has seen astonishing gains (TQQQ +91.79% at peak).
All of this amid broader economic uncertainty, including third consecutive month of bad jobs data:
Private payrolls saw their biggest decline in 2½ years during September, a further sign of labor market weakening that compounds the data blackout accompanying the U.S. government shutdown.
NASDAQ-100 52-week highs
The following NASDAQ-100 (QQQ) holdings closed at a 52-week high today:
MNST $69.62 +0.85%
📈113th day of uptrend
Day 📈1 of current uptrend occurred on Thurs. May 1st 2025.
QQQ+22.38% since start of current uptrendTQQQ+70.99% since start of current uptrend
| A | B | C | D | E | F | G | |
|---|---|---|---|---|---|---|---|
|
1
|
Market Signal | Trend Count | QQQ Close | QQQ %chg since 📈1 | TQQQ close | TQQQ %chg since 📈1 | Date |
|
2
|
2 | 📈1 | $481.68 | 0.00% | $56.77 | 0.00% | Thu 5/1/25 |
|
3
|
2 | 📈2 | $488.83 | 1.48% | $59.43 | 4.69% | Fri 5/2/25 |
|
4
|
2 | 📈3 | $485.93 | 0.88% | $58.40 | 2.87% | Mon 5/5/25 |
|
5
|
2 | 📈4 | $481.41 | -0.06% | $56.74 | -0.05% | Tue 5/6/25 |
|
6
|
2 | 📈5 | $483.30 | 0.34% | $57.40 | 1.11% | Wed 5/7/25 |
|
7
|
2 | 📈6 | $488.29 | 1.37% | $59.11 | 4.12% | Thu 5/8/25 |
|
8
|
2 | 📈7 | $487.97 | 1.31% | $58.97 | 3.88% | Fri 5/9/25 |
|
9
|
3 | 📈8 | $507.85 | 5.43% | $66.11 | 16.45% | Mon 5/12/25 |
|
10
|
3 | 📈9 | $515.59 | 7.04% | $69.14 | 21.79% | Tue 5/13/25 |
|
11
|
3 | 📈10 | $518.68 | 7.68% | $70.36 | 23.94% | Wed 5/14/25 |
|
12
|
3 | 📈11 | $519.25 | 7.80% | $70.58 | 24.33% | Thu 5/15/25 |
|
13
|
3 | 📈12 | $521.51 | 8.27% | $71.45 | 25.86% | Fri 5/16/25 |
|
14
|
3 | 📈13 | $522.01 | 8.37% | $71.64 | 26.19% | Mon 5/19/25 |
|
15
|
3 | 📈14 | $520.27 | 8.01% | $70.89 | 24.87% | Tue 5/20/25 |
|
16
|
3 | 📈15 | $513.04 | 6.51% | $67.94 | 19.68% | Wed 5/21/25 |
|
17
|
2 | 📈16 | $514.00 | 6.71% | $68.29 | 20.29% | Thu 5/22/25 |
|
18
|
2 | 📈17 | $509.24 | 5.72% | $66.32 | 16.82% | Fri 5/23/25 |
|
19
|
4 | 📈18 | $521.22 | 8.21% | $70.94 | 24.96% | Tue 5/27/25 |
|
20
|
3 | 📈19 | $518.91 | 7.73% | $70.03 | 23.36% | Wed 5/28/25 |
|
21
|
3 | 📈20 | $519.93 | 7.94% | $70.37 | 23.96% | Thu 5/29/25 |
|
22
|
3 | 📈21 | $519.11 | 7.77% | $70.00 | 23.30% | Fri 5/30/25 |
|
23
|
4 | 📈22 | $523.21 | 8.62% | $71.61 | 26.14% | Mon 6/2/25 |
|
24
|
4 | 📈23 | $527.30 | 9.47% | $73.28 | 29.08% | Tue 6/3/25 |
|
25
|
3 | 📈24 | $528.77 | 9.78% | $73.87 | 30.12% | Wed 6/4/25 |
|
26
|
3 | 📈25 | $524.79 | 8.95% | $72.15 | 27.09% | Thu 6/5/25 |
|
27
|
4 | 📈26 | $529.92 | 10.01% | $74.21 | 30.72% | Fri 6/6/25 |
|
28
|
3 | 📈27 | $530.70 | 10.18% | $74.54 | 31.30% | Mon 6/9/25 |
|
29
|
3 | 📈28 | $534.21 | 10.91% | $75.98 | 33.84% | Tue 6/10/25 |
|
30
|
3 | 📈29 | $532.41 | 10.53% | $75.20 | 32.46% | Wed 6/11/25 |
|
31
|
3 | 📈30 | $533.66 | 10.79% | $75.69 | 33.33% | Thu 6/12/25 |
|
32
|
2 | 📈31 | $526.96 | 9.40% | $72.83 | 28.29% | Fri 6/13/25 |
|
33
|
3 | 📈32 | $534.29 | 10.92% | $75.80 | 33.52% | Mon 6/16/25 |
|
34
|
2 | 📈33 | $529.08 | 9.84% | $73.56 | 29.58% | Tue 6/17/25 |
|
35
|
2 | 📈34 | $528.99 | 9.82% | $73.46 | 29.40% | Wed 6/18/25 |
|
36
|
2 | 📈35 | $526.83 | 9.37% | $72.45 | 27.62% | Fri 6/20/25 |
|
37
|
7 | 📈36 | $531.65 | 10.37% | $74.70 | 31.58% | Mon 6/23/25 |
|
38
|
7 | 📈37 | $539.78 | 12.06% | $78.10 | 37.57% | Tue 6/24/25 |
|
39
|
7 | 📈38 | $541.16 | 12.35% | $78.48 | 38.24% | Wed 6/25/25 |
|
40
|
8 | 📈39 | $546.22 | 13.40% | $80.63 | 42.03% | Thu 6/26/25 |
|
41
|
7 | 📈40 | $548.09 | 13.79% | $81.42 | 43.42% | Fri 6/27/25 |
|
42
|
8 | 📈41 | $551.64 | 14.52% | $83.00 | 46.20% | Mon 6/30/25 |
|
43
|
7 | 📈42 | $546.99 | 13.56% | $80.89 | 42.49% | Tue 7/1/25 |
|
44
|
7 | 📈43 | $550.80 | 14.35% | $82.50 | 45.32% | Wed 7/2/25 |
|
45
|
8 | 📈44 | $556.22 | 15.48% | $84.81 | 49.39% | Thu 7/3/25 |
|
46
|
7 | 📈45 | $552.03 | 14.61% | $82.92 | 46.06% | Mon 7/7/25 |
|
47
|
7 | 📈46 | $552.34 | 14.67% | $83.03 | 46.26% | Tue 7/8/25 |
|
48
|
7 | 📈47 | $556.25 | 15.48% | $84.75 | 49.29% | Wed 7/9/25 |
|
49
|
7 | 📈48 | $555.45 | 15.32% | $84.36 | 48.60% | Thu 7/10/25 |
|
50
|
7 | 📈49 | $554.20 | 15.06% | $83.72 | 47.47% | Fri 7/11/25 |
|
51
|
7 | 📈50 | $556.21 | 15.47% | $84.61 | 49.04% | Mon 7/14/25 |
|
52
|
7 | 📈51 | $556.72 | 15.58% | $84.83 | 49.43% | Tue 7/15/25 |
|
53
|
7 | 📈52 | $557.29 | 15.70% | $85.07 | 49.85% | Wed 7/16/25 |
|
54
|
7 | 📈53 | $561.80 | 16.63% | $87.05 | 53.34% | Thu 7/17/25 |
|
55
|
7 | 📈54 | $561.26 | 16.52% | $86.75 | 52.81% | Fri 7/18/25 |
|
56
|
7 | 📈55 | $564.17 | 17.13% | $88.07 | 55.13% | Mon 7/21/25 |
|
57
|
7 | 📈56 | $561.25 | 16.52% | $86.70 | 52.72% | Tue 7/22/25 |
|
58
|
7 | 📈57 | $563.81 | 17.05% | $87.84 | 54.73% | Wed 7/23/25 |
|
59
|
7 | 📈58 | $565.01 | 17.30% | $88.42 | 55.75% | Thu 7/24/25 |
|
60
|
7 | 📈59 | $566.37 | 17.58% | $88.92 | 56.63% | Fri 7/25/25 |
|
61
|
7 | 📈60 | $568.14 | 17.95% | $89.79 | 58.16% | Mon 7/28/25 |
|
62
|
7 | 📈61 | $567.26 | 17.77% | $89.38 | 57.44% | Tue 7/29/25 |
|
63
|
7 | 📈62 | $568.02 | 17.92% | $89.69 | 57.99% | Wed 7/30/25 |
|
64
|
6 | 📈63 | $565.01 | 17.30% | $88.21 | 55.38% | Thu 7/31/25 |
|
65
|
5 | 📈64 | $553.88 | 14.99% | $82.92 | 46.06% | Fri 8/1/25 |
|
66
|
7 | 📈65 | $564.10 | 17.11% | $87.46 | 54.06% | Mon 8/4/25 |
|
67
|
6 | 📈66 | $560.27 | 16.32% | $85.64 | 50.85% | Tue 8/5/25 |
|
68
|
7 | 📈67 | $567.32 | 17.78% | $88.84 | 56.49% | Wed 8/6/25 |
|
69
|
7 | 📈68 | $569.24 | 18.18% | $89.74 | 58.08% | Thu 8/7/25 |
|
70
|
7 | 📈69 | $574.55 | 19.28% | $92.16 | 62.34% | Fri 8/8/25 |
|
71
|
7 | 📈70 | $572.85 | 18.93% | $91.35 | 60.91% | Mon 8/11/25 |
|
72
|
7 | 📈71 | $580.05 | 20.42% | $94.72 | 66.85% | Tue 8/12/25 |
|
73
|
7 | 📈72 | $580.34 | 20.48% | $94.86 | 67.10% | Wed 8/13/25 |
|
74
|
7 | 📈73 | $579.89 | 20.39% | $94.60 | 66.64% | Thu 8/14/25 |
|
75
|
7 | 📈74 | $577.34 | 19.86% | $93.26 | 64.28% | Fri 8/15/25 |
|
76
|
7 | 📈75 | $577.11 | 19.81% | $93.14 | 64.07% | Mon 8/18/25 |
|
77
|
6 | 📈76 | $569.28 | 18.19% | $89.34 | 57.37% | Tue 8/19/25 |
|
78
|
5 | 📈77 | $565.90 | 17.48% | $87.71 | 54.50% | Wed 8/20/25 |
|
79
|
5 | 📈78 | $563.28 | 16.94% | $86.49 | 52.35% | Thu 8/21/25 |
|
80
|
6 | 📈79 | $571.97 | 18.74% | $90.38 | 59.20% | Fri 8/22/25 |
|
81
|
6 | 📈80 | $570.32 | 18.40% | $89.59 | 57.81% | Mon 8/25/25 |
|
82
|
6 | 📈81 | $572.61 | 18.88% | $90.63 | 59.64% | Tue 8/26/25 |
|
83
|
7 | 📈82 | $573.49 | 19.06% | $91.04 | 60.37% | Wed 8/27/25 |
|
84
|
7 | 📈83 | $577.08 | 19.81% | $92.70 | 63.29% | Thu 8/28/25 |
|
85
|
5 | 📈84 | $570.40 | 18.42% | $89.36 | 57.41% | Fri 8/29/25 |
|
86
|
5 | 📈85 | $565.62 | 17.43% | $87.08 | 53.39% | Tue 9/2/25 |
|
87
|
6.5 | 📈86 | $570.07 | 18.35% | $89.11 | 56.97% | Wed 9/3/25 |
|
88
|
7 | 📈87 | $575.23 | 19.42% | $91.52 | 61.21% | Thu 9/4/25 |
|
89
|
7 | 📈88 | $576.06 | 19.59% | $91.82 | 61.74% | Fri 9/5/25 |
|
90
|
7 | 📈89 | $578.87 | 20.18% | $93.13 | 64.05% | Mon 9/8/25 |
|
91
|
7 | 📈90 | $580.51 | 20.52% | $93.89 | 65.39% | Tue 9/9/25 |
|
92
|
7 | 📈91 | $580.70 | 20.56% | $93.99 | 65.56% | Wed 9/10/25 |
|
93
|
7 | 📈92 | $584.08 | 21.26% | $95.57 | 68.35% | Thu 9/11/25 |
|
94
|
7 | 📈93 | $586.66 | 21.79% | $96.76 | 70.44% | Fri 9/12/25 |
|
95
|
7 | 📈94 | $591.68 | 22.84% | $99.23 | 74.79% | Mon 9/15/25 |
|
96
|
7 | 📈95 | $591.18 | 22.73% | $98.96 | 74.32% | Tue 9/16/25 |
|
97
|
7 | 📈96 | $590.00 | 22.49% | $98.33 | 73.21% | Wed 9/17/25 |
|
98
|
7 | 📈97 | $595.32 | 23.59% | $100.98 | 77.88% | Thu 9/18/25 |
|
99
|
7 | 📈98 | $599.35 | 24.43% | $102.98 | 81.40% | Fri 9/19/25 |
|
100
|
7 | 📈99 | $602.20 | 25.02% | $104.72 | 84.46% | Mon 9/22/25 |
|
101
|
7 | 📈100 | $598.20 | 24.19% | $102.61 | 80.75% | Tue 9/23/25 |
|
102
|
7 | 📈101 | $596.10 | 23.75% | $101.41 | 78.63% | Wed 9/24/25 |
|
103
|
6 | 📈102 | $593.53 | 23.22% | $100.05 | 76.24% | Thu 9/25/25 |
|
104
|
7 | 📈103 | $595.97 | 23.73% | $101.25 | 78.35% | Fri 9/26/25 |
|
105
|
7 | 📈104 | $598.73 | 24.30% | $102.60 | 80.73% | Mon 9/29/25 |
|
106
|
7 | 📈105 | $600.37 | 24.64% | $103.40 | 82.14% | Tue 9/30/25 |
|
107
|
7 | 📈106 | $603.25 | 25.24% | $104.86 | 84.71% | Wed 10/1/25 |
|
108
|
8 | 📈107 | $605.73 | 25.75% | $106.14 | 86.96% | Thu 10/2/25 |
|
109
|
7 | 📈108 | $603.18 | 25.22% | $104.70 | 84.43% | Fri 10/3/25 |
|
110
|
8 | 📈109 | $607.71 | 26.16% | $107.04 | 88.55% | Mon 10/6/25 |
|
111
|
7 | 📈110 | $604.51 | 25.50% | $105.31 | 85.50% | Tue 10/7/25 |
|
112
|
8 | 📈111 | $611.44 | 26.94% | $108.88 | 91.79% | Wed 10/8/25 |
|
113
|
7 | 📈112 | $610.70 | 26.79% | $108.45 | 91.03% | Thu 10/9/25 |
|
114
|
5 | 📈113 | $589.50 | 22.38% | $97.07 | 70.99% | Fri 10/10/25 |
Market Signal, Trend Count, closing prices, and cumulative return (%) over current uptrend
TQQQ vs QQQ Holdings
Despite the big hit on Friday, TQQQ is still outperforming 94% of QQQ holdings since day 📈1 of current uptrend (Thurs. May 1st 2025), including all of the Magnificent 7.
There is just a 6 in 100 or 6% chance of having picked QQQ holdings that performed TQQQ between day 📈1 of the current uptrend and now.
| A | B | C | D | E | |
|---|---|---|---|---|---|
|
1
|
Market Cap | Symbol | %Chg since 📈1 | Close on 📈1 | Close |
|
2
|
379,756 M | QQQ | 22.38% | $481.68 | $589.50 |
|
3
|
203,840 M | MU | 133.51% | $77.77 | $181.60 |
|
4
|
348,749 M | AMD | 122.35% | $96.65 | $214.90 |
|
5
|
192,765 M | APP | 103.90% | $279.49 | $569.89 |
|
6
|
42,336 M | WBD | 102.85% | $8.43 | $17.10 |
|
7
|
165,662 M | LRCX | 83.15% | $71.73 | $131.37 |
|
8
|
173,020 M | INTC | 82.03% | $19.98 | $36.37 |
|
9
|
25,714 M | TQQQ | 70.99% | $56.77 | $97.07 |
|
10
|
1,533,021 M | AVGO | 64.51% | $197.33 | $324.63 |
|
11
|
4,459,397 M | NVDA | 64.11% | $111.61 | $183.16 |
|
12
|
196,275 M | SHOP | 55.67% | $97.01 | $151.02 |
|
13
|
115,118 M | CEG | 53.15% | $240.62 | $368.49 |
|
14
|
416,204 M | PLTR | 50.98% | $116.20 | $175.44 |
|
15
|
55,360 M | DDOG | 49.30% | $106.32 | $158.74 |
|
16
|
1,374,917 M | TSLA | 47.40% | $280.52 | $413.49 |
|
17
|
2,861,078 M | GOOGL | 46.66% | $161.30 | $236.57 |
|
18
|
2,872,204 M | GOOG | 45.89% | $162.79 | $237.49 |
|
19
|
129,413 M | KLAC | 45.31% | $676.31 | $982.75 |
|
20
|
167,255 M | AMAT | 40.94% | $148.96 | $209.95 |
|
21
|
73,804 M | MRVL | 40.46% | $60.95 | $85.61 |
|
22
|
363,380 M | ASML | 40.42% | $666.72 | $936.19 |
|
23
|
49,874 M | EA | 37.85% | $145.10 | $200.02 |
|
24
|
49,054 M | ZS | 36.47% | $227.06 | $309.88 |
|
25
|
113,642 M | DASH | 35.59% | $196.20 | $266.02 |
|
26
|
163,985 M | ARM | 34.15% | $115.40 | $154.81 |
|
27
|
32,602 M | MCHP | 31.38% | $45.98 | $60.41 |
|
28
|
49,295 M | IDXX | 30.71% | $471.38 | $616.15 |
|
29
|
66,163 M | CSX | 26.25% | $28.11 | $35.49 |
|
30
|
44,404 M | BKR | 24.45% | $36.19 | $45.04 |
|
31
|
1,771,813 M | META | 23.26% | $572.21 | $705.30 |
|
32
|
379,756 M | QQQ | 22.38% | $481.68 | $589.50 |
|
33
|
21,489 M | BIIB | 21.20% | $120.93 | $146.57 |
|
34
|
3,798,051 M | MSFT | 20.11% | $425.40 | $510.96 |
|
35
|
262,087 M | AZN | 19.88% | $70.51 | $84.53 |
|
36
|
176,419 M | PDD | 17.27% | $105.97 | $124.27 |
|
37
|
67,979 M | MNST | 16.97% | $59.52 | $69.62 |
|
38
|
268,580 M | CSCO | 16.90% | $58.12 | $67.94 |
|
39
|
110,847 M | ADI | 16.30% | $193.74 | $225.32 |
|
40
|
18,706 M | ON | 15.51% | $39.60 | $45.74 |
|
41
|
3,639,902 M | AAPL | 14.98% | $213.32 | $245.27 |
|
42
|
47,864 M | XEL | 14.96% | $70.40 | $80.93 |
|
43
|
123,887 M | CRWD | 14.30% | $431.88 | $493.66 |
|
44
|
2,307,567 M | AMZN | 13.76% | $190.20 | $216.37 |
|
45
|
165,724 M | QCOM | 13.59% | $135.21 | $153.59 |
|
46
|
145,398 M | GILD | 13.49% | $103.25 | $117.18 |
|
47
|
52,539 M | FAST | 13.44% | $40.35 | $45.78 |
|
48
|
55,191 M | AXON | 13.19% | $621.10 | $703.03 |
|
49
|
51,777 M | NXPI | 12.94% | $181.84 | $205.37 |
|
50
|
205,210 M | PEP | 12.38% | $133.55 | $150.08 |
|
51
|
141,161 M | PANW | 11.96% | $186.27 | $208.55 |
|
52
|
64,646 M | ADSK | 10.97% | $273.49 | $303.50 |
|
53
|
89,104 M | CDNS | 9.10% | $299.73 | $327.00 |
|
54
|
86,674 M | ORLY | 8.85% | $93.85 | $102.15 |
|
55
|
62,592 M | AEP | 8.83% | $107.54 | $117.04 |
|
56
|
156,099 M | TXN | 8.49% | $158.26 | $171.70 |
|
57
|
518,444 M | NFLX | 7.64% | $1,133.47 | $1,220.08 |
|
58
|
46,481 M | TTWO | 7.14% | $235.17 | $251.97 |
|
59
|
66,724 M | PYPL | 6.77% | $65.41 | $69.84 |
|
60
|
70,633 M | MAR | 6.66% | $243.95 | $260.20 |
|
61
|
48,039 M | ROST | 6.32% | $138.93 | $147.71 |
|
62
|
32,420 M | GEHC | 4.94% | $67.67 | $71.01 |
|
63
|
40,476 M | FANG | 3.70% | $134.83 | $139.82 |
|
64
|
48,835 M | PCAR | 3.59% | $89.78 | $93.00 |
|
65
|
178,934 M | INTU | 2.98% | $623.19 | $641.79 |
|
66
|
156,195 M | AMGN | 2.24% | $283.78 | $290.13 |
|
67
|
212,801 M | LIN | 1.29% | $448.05 | $453.82 |
|
68
|
167,395 M | BKNG | 1.24% | $5,101.43 | $5,164.93 |
|
69
|
47,540 M | EXC | 1.01% | $46.60 | $47.07 |
|
70
|
32,019 M | CSGP | -1.31% | $76.58 | $75.58 |
|
71
|
25,601 M | TTD | -1.32% | $53.06 | $52.36 |
|
72
|
39,801 M | CCEP | -1.83% | $89.54 | $87.90 |
|
73
|
59,844 M | REGN | -4.30% | $590.00 | $564.63 |
|
74
|
89,185 M | SBUX | -4.33% | $82.01 | $78.46 |
|
75
|
81,529 M | SNPS | -4.45% | $459.36 | $438.92 |
|
76
|
115,527 M | ADP | -4.52% | $298.69 | $285.19 |
|
77
|
127,557 M | HON | -4.66% | $210.74 | $200.91 |
|
78
|
72,360 M | ABNB | -4.69% | $124.01 | $118.19 |
|
79
|
62,259 M | WDAY | -5.45% | $246.61 | $233.18 |
|
80
|
18,292 M | GFS | -6.31% | $35.18 | $32.96 |
|
81
|
412,161 M | COST | -6.91% | $999.04 | $930.01 |
|
82
|
108,171 M | MELI | -7.01% | $2,294.52 | $2,133.67 |
|
83
|
25,537 M | DXCM | -7.32% | $70.26 | $65.12 |
|
84
|
257,485 M | TMUS | -7.37% | $247.00 | $228.79 |
|
85
|
54,775 M | ROP | -8.71% | $557.59 | $509.00 |
|
86
|
79,513 M | MDLZ | -9.46% | $67.87 | $61.45 |
|
87
|
141,282 M | ADBE | -9.91% | $374.63 | $337.51 |
|
88
|
75,535 M | CTAS | -10.30% | $209.55 | $187.96 |
|
89
|
19,009 M | CDW | -10.69% | $162.40 | $145.04 |
|
90
|
28,228 M | ODFL | -10.79% | $150.56 | $134.31 |
|
91
|
29,768 M | KHC | -11.75% | $28.50 | $25.15 |
|
92
|
32,136 M | CTSH | -12.53% | $75.23 | $65.80 |
|
93
|
108,772 M | CMCSA | -12.89% | $33.82 | $29.46 |
|
94
|
45,185 M | PAYX | -14.36% | $146.61 | $125.55 |
|
95
|
153,998 M | ISRG | -16.94% | $517.18 | $429.59 |
|
96
|
33,959 M | VRSK | -17.47% | $294.51 | $243.06 |
|
97
|
104,554 M | VRTX | -18.26% | $498.86 | $407.79 |
|
98
|
68,243 M | TRI | -18.48% | $185.74 | $151.42 |
|
99
|
87,508 M | MSTR | -20.13% | $381.60 | $304.79 |
|
100
|
63,631 M | FTNT | -20.31% | $104.21 | $83.04 |
|
101
|
35,075 M | KDP | -24.15% | $34.04 | $25.82 |
|
102
|
42,464 M | CPRT | -27.47% | $60.50 | $43.88 |
|
103
|
35,444 M | CHTR | -32.25% | $383.00 | $259.49 |
|
104
|
37,923 M | TEAM | -36.89% | $229.07 | $144.56 |
|
105
|
19,864 M | LULU | -37.64% | $268.60 | $167.51 |
Assuming 3% for the risk-free rate, the Sharpe Ratio for this investment is 2.99.
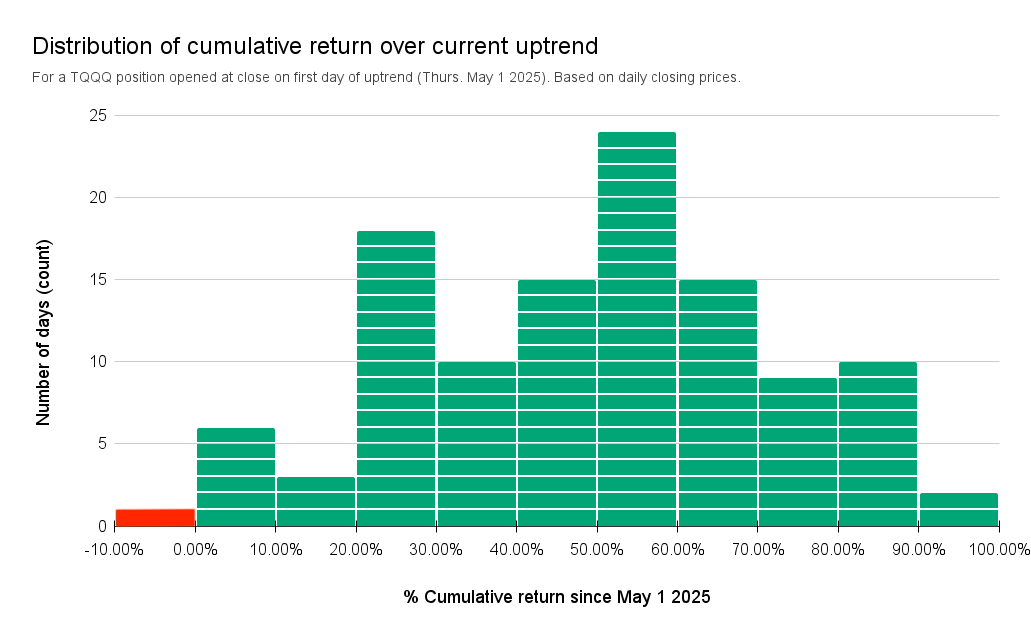
If you entered a TQQQ position when the Market Signal indicated an uptrend (day 📈1 of current uptrend Thurs. May 1st 2025), and held til now - more than half the days since then offered to close the position a return greater than +50%.