Oct. 3rd 2025
Uptrend approaches longest on record
Market Signal: +7 STRONG BULLISH
Somewhat astonishingly, the NASDAQ-100 (QQQ) continues to show strength. QQQ successively closed at all-time highs on Wed. Oct. 1st 2025 and Thurs. Oct. 2nd 2025. These days saw 9% and 11% of the index's holdings close at 52-week highs respectively.
On Thurs. Oct. 2nd 2025 the Market Signal was +8 STRONG BULLISH. This has not occurred since Thurs. Jul. 3rd 2025, which was 5 days after breaking through the prior all-time high of $539.52 set on Wed. Feb. 19th 2025.
On Fri. Oct. 3rd 2025, QQQ closed just above the top of the range described last week.
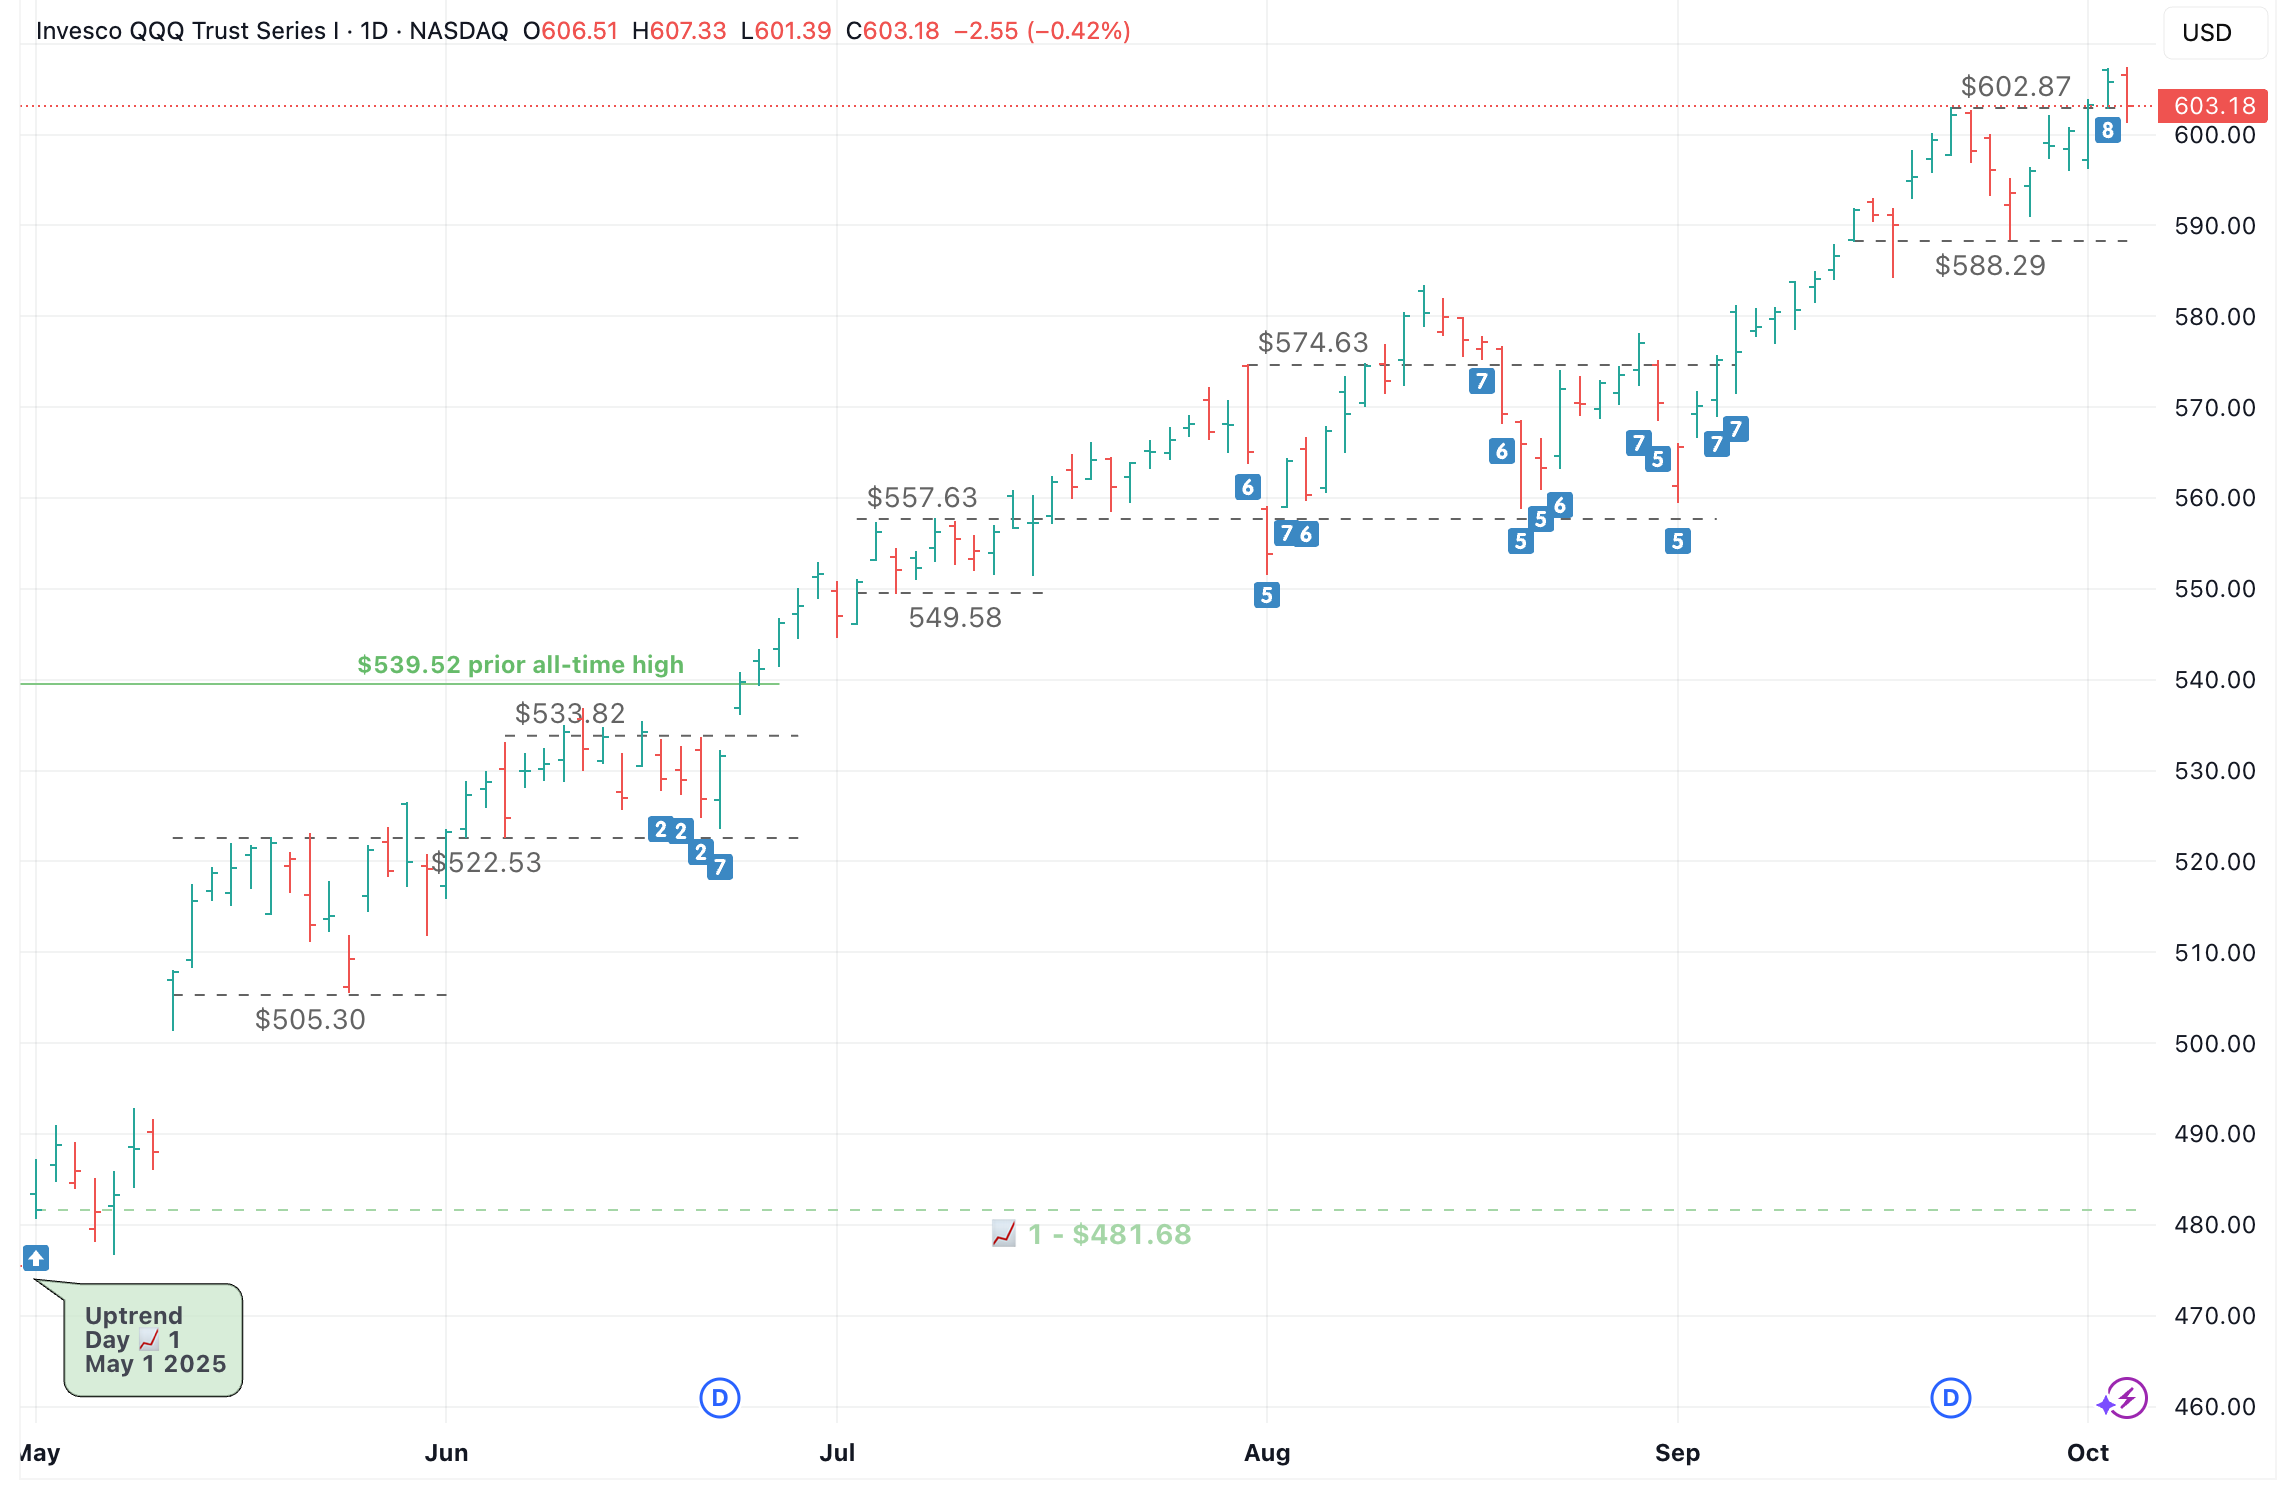
QQQ has seen 6 weeks close at an all-time high during the current uptrendThe longest uptrend on record lasted 📈111 days, ending on Fri. Apr. 12th 2024 (see case study).
NASDAQ-100 52-week highs
The following NASDAQ-100 (QQQ) holdings closed at a 52-week high today:
ASML $1,032.22 +0.20%AZN $85.31 +1.98%MU $187.83 +2.22%SHOP $161.14 +6.50%CEG $360.00 +0.71%
📈108th day of uptrend
Day 📈1 of current uptrend occurred on Thurs. May 1st 2025.
QQQ+25.22% since start of current uptrendTQQQ+84.43% since start of current uptrend
| A | B | C | D | E | F | G | |
|---|---|---|---|---|---|---|---|
|
1
|
Market Signal | Trend Count | QQQ Close | QQQ %chg since 📈1 | TQQQ close | TQQQ %chg since 📈1 | Date |
|
2
|
2 | 📈1 | $481.68 | 0.00% | $56.77 | 0.00% | Thu 5/1/25 |
|
3
|
2 | 📈2 | $488.83 | 1.48% | $59.43 | 4.69% | Fri 5/2/25 |
|
4
|
2 | 📈3 | $485.93 | 0.88% | $58.40 | 2.87% | Mon 5/5/25 |
|
5
|
2 | 📈4 | $481.41 | -0.06% | $56.74 | -0.05% | Tue 5/6/25 |
|
6
|
2 | 📈5 | $483.30 | 0.34% | $57.40 | 1.11% | Wed 5/7/25 |
|
7
|
2 | 📈6 | $488.29 | 1.37% | $59.11 | 4.12% | Thu 5/8/25 |
|
8
|
2 | 📈7 | $487.97 | 1.31% | $58.97 | 3.88% | Fri 5/9/25 |
|
9
|
3 | 📈8 | $507.85 | 5.43% | $66.11 | 16.45% | Mon 5/12/25 |
|
10
|
3 | 📈9 | $515.59 | 7.04% | $69.14 | 21.79% | Tue 5/13/25 |
|
11
|
3 | 📈10 | $518.68 | 7.68% | $70.36 | 23.94% | Wed 5/14/25 |
|
12
|
3 | 📈11 | $519.25 | 7.80% | $70.58 | 24.33% | Thu 5/15/25 |
|
13
|
3 | 📈12 | $521.51 | 8.27% | $71.45 | 25.86% | Fri 5/16/25 |
|
14
|
3 | 📈13 | $522.01 | 8.37% | $71.64 | 26.19% | Mon 5/19/25 |
|
15
|
3 | 📈14 | $520.27 | 8.01% | $70.89 | 24.87% | Tue 5/20/25 |
|
16
|
3 | 📈15 | $513.04 | 6.51% | $67.94 | 19.68% | Wed 5/21/25 |
|
17
|
2 | 📈16 | $514.00 | 6.71% | $68.29 | 20.29% | Thu 5/22/25 |
|
18
|
2 | 📈17 | $509.24 | 5.72% | $66.32 | 16.82% | Fri 5/23/25 |
|
19
|
4 | 📈18 | $521.22 | 8.21% | $70.94 | 24.96% | Tue 5/27/25 |
|
20
|
3 | 📈19 | $518.91 | 7.73% | $70.03 | 23.36% | Wed 5/28/25 |
|
21
|
3 | 📈20 | $519.93 | 7.94% | $70.37 | 23.96% | Thu 5/29/25 |
|
22
|
3 | 📈21 | $519.11 | 7.77% | $70.00 | 23.30% | Fri 5/30/25 |
|
23
|
4 | 📈22 | $523.21 | 8.62% | $71.61 | 26.14% | Mon 6/2/25 |
|
24
|
4 | 📈23 | $527.30 | 9.47% | $73.28 | 29.08% | Tue 6/3/25 |
|
25
|
3 | 📈24 | $528.77 | 9.78% | $73.87 | 30.12% | Wed 6/4/25 |
|
26
|
3 | 📈25 | $524.79 | 8.95% | $72.15 | 27.09% | Thu 6/5/25 |
|
27
|
4 | 📈26 | $529.92 | 10.01% | $74.21 | 30.72% | Fri 6/6/25 |
|
28
|
3 | 📈27 | $530.70 | 10.18% | $74.54 | 31.30% | Mon 6/9/25 |
|
29
|
3 | 📈28 | $534.21 | 10.91% | $75.98 | 33.84% | Tue 6/10/25 |
|
30
|
3 | 📈29 | $532.41 | 10.53% | $75.20 | 32.46% | Wed 6/11/25 |
|
31
|
3 | 📈30 | $533.66 | 10.79% | $75.69 | 33.33% | Thu 6/12/25 |
|
32
|
2 | 📈31 | $526.96 | 9.40% | $72.83 | 28.29% | Fri 6/13/25 |
|
33
|
3 | 📈32 | $534.29 | 10.92% | $75.80 | 33.52% | Mon 6/16/25 |
|
34
|
2 | 📈33 | $529.08 | 9.84% | $73.56 | 29.58% | Tue 6/17/25 |
|
35
|
2 | 📈34 | $528.99 | 9.82% | $73.46 | 29.40% | Wed 6/18/25 |
|
36
|
2 | 📈35 | $526.83 | 9.37% | $72.45 | 27.62% | Fri 6/20/25 |
|
37
|
7 | 📈36 | $531.65 | 10.37% | $74.70 | 31.58% | Mon 6/23/25 |
|
38
|
7 | 📈37 | $539.78 | 12.06% | $78.10 | 37.57% | Tue 6/24/25 |
|
39
|
7 | 📈38 | $541.16 | 12.35% | $78.48 | 38.24% | Wed 6/25/25 |
|
40
|
8 | 📈39 | $546.22 | 13.40% | $80.63 | 42.03% | Thu 6/26/25 |
|
41
|
7 | 📈40 | $548.09 | 13.79% | $81.42 | 43.42% | Fri 6/27/25 |
|
42
|
8 | 📈41 | $551.64 | 14.52% | $83.00 | 46.20% | Mon 6/30/25 |
|
43
|
7 | 📈42 | $546.99 | 13.56% | $80.89 | 42.49% | Tue 7/1/25 |
|
44
|
7 | 📈43 | $550.80 | 14.35% | $82.50 | 45.32% | Wed 7/2/25 |
|
45
|
8 | 📈44 | $556.22 | 15.48% | $84.81 | 49.39% | Thu 7/3/25 |
|
46
|
7 | 📈45 | $552.03 | 14.61% | $82.92 | 46.06% | Mon 7/7/25 |
|
47
|
7 | 📈46 | $552.34 | 14.67% | $83.03 | 46.26% | Tue 7/8/25 |
|
48
|
7 | 📈47 | $556.25 | 15.48% | $84.75 | 49.29% | Wed 7/9/25 |
|
49
|
7 | 📈48 | $555.45 | 15.32% | $84.36 | 48.60% | Thu 7/10/25 |
|
50
|
7 | 📈49 | $554.20 | 15.06% | $83.72 | 47.47% | Fri 7/11/25 |
|
51
|
7 | 📈50 | $556.21 | 15.47% | $84.61 | 49.04% | Mon 7/14/25 |
|
52
|
7 | 📈51 | $556.72 | 15.58% | $84.83 | 49.43% | Tue 7/15/25 |
|
53
|
7 | 📈52 | $557.29 | 15.70% | $85.07 | 49.85% | Wed 7/16/25 |
|
54
|
7 | 📈53 | $561.80 | 16.63% | $87.05 | 53.34% | Thu 7/17/25 |
|
55
|
7 | 📈54 | $561.26 | 16.52% | $86.75 | 52.81% | Fri 7/18/25 |
|
56
|
7 | 📈55 | $564.17 | 17.13% | $88.07 | 55.13% | Mon 7/21/25 |
|
57
|
7 | 📈56 | $561.25 | 16.52% | $86.70 | 52.72% | Tue 7/22/25 |
|
58
|
7 | 📈57 | $563.81 | 17.05% | $87.84 | 54.73% | Wed 7/23/25 |
|
59
|
7 | 📈58 | $565.01 | 17.30% | $88.42 | 55.75% | Thu 7/24/25 |
|
60
|
7 | 📈59 | $566.37 | 17.58% | $88.92 | 56.63% | Fri 7/25/25 |
|
61
|
7 | 📈60 | $568.14 | 17.95% | $89.79 | 58.16% | Mon 7/28/25 |
|
62
|
7 | 📈61 | $567.26 | 17.77% | $89.38 | 57.44% | Tue 7/29/25 |
|
63
|
7 | 📈62 | $568.02 | 17.92% | $89.69 | 57.99% | Wed 7/30/25 |
|
64
|
6 | 📈63 | $565.01 | 17.30% | $88.21 | 55.38% | Thu 7/31/25 |
|
65
|
5 | 📈64 | $553.88 | 14.99% | $82.92 | 46.06% | Fri 8/1/25 |
|
66
|
7 | 📈65 | $564.10 | 17.11% | $87.46 | 54.06% | Mon 8/4/25 |
|
67
|
6 | 📈66 | $560.27 | 16.32% | $85.64 | 50.85% | Tue 8/5/25 |
|
68
|
7 | 📈67 | $567.32 | 17.78% | $88.84 | 56.49% | Wed 8/6/25 |
|
69
|
7 | 📈68 | $569.24 | 18.18% | $89.74 | 58.08% | Thu 8/7/25 |
|
70
|
7 | 📈69 | $574.55 | 19.28% | $92.16 | 62.34% | Fri 8/8/25 |
|
71
|
7 | 📈70 | $572.85 | 18.93% | $91.35 | 60.91% | Mon 8/11/25 |
|
72
|
7 | 📈71 | $580.05 | 20.42% | $94.72 | 66.85% | Tue 8/12/25 |
|
73
|
7 | 📈72 | $580.34 | 20.48% | $94.86 | 67.10% | Wed 8/13/25 |
|
74
|
7 | 📈73 | $579.89 | 20.39% | $94.60 | 66.64% | Thu 8/14/25 |
|
75
|
7 | 📈74 | $577.34 | 19.86% | $93.26 | 64.28% | Fri 8/15/25 |
|
76
|
7 | 📈75 | $577.11 | 19.81% | $93.14 | 64.07% | Mon 8/18/25 |
|
77
|
6 | 📈76 | $569.28 | 18.19% | $89.34 | 57.37% | Tue 8/19/25 |
|
78
|
5 | 📈77 | $565.90 | 17.48% | $87.71 | 54.50% | Wed 8/20/25 |
|
79
|
5 | 📈78 | $563.28 | 16.94% | $86.49 | 52.35% | Thu 8/21/25 |
|
80
|
6 | 📈79 | $571.97 | 18.74% | $90.38 | 59.20% | Fri 8/22/25 |
|
81
|
6 | 📈80 | $570.32 | 18.40% | $89.59 | 57.81% | Mon 8/25/25 |
|
82
|
6 | 📈81 | $572.61 | 18.88% | $90.63 | 59.64% | Tue 8/26/25 |
|
83
|
7 | 📈82 | $573.49 | 19.06% | $91.04 | 60.37% | Wed 8/27/25 |
|
84
|
7 | 📈83 | $577.08 | 19.81% | $92.70 | 63.29% | Thu 8/28/25 |
|
85
|
5 | 📈84 | $570.40 | 18.42% | $89.36 | 57.41% | Fri 8/29/25 |
|
86
|
5 | 📈85 | $565.62 | 17.43% | $87.08 | 53.39% | Tue 9/2/25 |
|
87
|
6.5 | 📈86 | $570.07 | 18.35% | $89.11 | 56.97% | Wed 9/3/25 |
|
88
|
7 | 📈87 | $575.23 | 19.42% | $91.52 | 61.21% | Thu 9/4/25 |
|
89
|
7 | 📈88 | $576.06 | 19.59% | $91.82 | 61.74% | Fri 9/5/25 |
|
90
|
7 | 📈89 | $578.87 | 20.18% | $93.13 | 64.05% | Mon 9/8/25 |
|
91
|
7 | 📈90 | $580.51 | 20.52% | $93.89 | 65.39% | Tue 9/9/25 |
|
92
|
7 | 📈91 | $580.70 | 20.56% | $93.99 | 65.56% | Wed 9/10/25 |
|
93
|
7 | 📈92 | $584.08 | 21.26% | $95.57 | 68.35% | Thu 9/11/25 |
|
94
|
7 | 📈93 | $586.66 | 21.79% | $96.76 | 70.44% | Fri 9/12/25 |
|
95
|
7 | 📈94 | $591.68 | 22.84% | $99.23 | 74.79% | Mon 9/15/25 |
|
96
|
7 | 📈95 | $591.18 | 22.73% | $98.96 | 74.32% | Tue 9/16/25 |
|
97
|
7 | 📈96 | $590.00 | 22.49% | $98.33 | 73.21% | Wed 9/17/25 |
|
98
|
7 | 📈97 | $595.32 | 23.59% | $100.98 | 77.88% | Thu 9/18/25 |
|
99
|
7 | 📈98 | $599.35 | 24.43% | $102.98 | 81.40% | Fri 9/19/25 |
|
100
|
7 | 📈99 | $602.20 | 25.02% | $104.72 | 84.46% | Mon 9/22/25 |
|
101
|
7 | 📈100 | $598.20 | 24.19% | $102.61 | 80.75% | Tue 9/23/25 |
|
102
|
7 | 📈101 | $596.10 | 23.75% | $101.41 | 78.63% | Wed 9/24/25 |
|
103
|
6 | 📈102 | $593.53 | 23.22% | $100.05 | 76.24% | Thu 9/25/25 |
|
104
|
7 | 📈103 | $595.97 | 23.73% | $101.25 | 78.35% | Fri 9/26/25 |
|
105
|
7 | 📈104 | $598.73 | 24.30% | $102.60 | 80.73% | Mon 9/29/25 |
|
106
|
7 | 📈105 | $600.37 | 24.64% | $103.40 | 82.14% | Tue 9/30/25 |
|
107
|
7 | 📈106 | $603.25 | 25.24% | $104.86 | 84.71% | Wed 10/1/25 |
|
108
|
8 | 📈107 | $605.73 | 25.75% | $106.14 | 86.96% | Thu 10/2/25 |
|
109
|
7 | 📈108 | $603.18 | 25.22% | $104.70 | 84.43% | Fri 10/3/25 |
Market Signal, Trend Count, closing prices, and cumulative return (%) over current uptrend
TQQQ vs QQQ Holdings
TQQQ is outperforming 96% of QQQ holdings since day 📈1 of current uptrend (Thurs. May 1st 2025).
| A | B | C | D | E | |
|---|---|---|---|---|---|
|
1
|
Market Cap | Symbol | %Chg since 📈1 | Close on 📈1 | Close |
|
2
|
387,030 M | QQQ | 25.22% | $481.68 | $603.18 |
|
3
|
230,944 M | APP | 144.29% | $279.49 | $682.76 |
|
4
|
210,205 M | MU | 141.52% | $77.77 | $187.83 |
|
5
|
47,015 M | WBD | 125.27% | $8.43 | $18.99 |
|
6
|
183,871 M | LRCX | 103.28% | $71.73 | $145.81 |
|
7
|
27,871 M | TQQQ | 84.43% | $56.77 | $104.70 |
|
8
|
175,208 M | INTC | 84.33% | $19.98 | $36.83 |
|
9
|
1,597,907 M | AVGO | 71.47% | $197.33 | $338.37 |
|
10
|
267,234 M | AMD | 70.38% | $96.65 | $164.67 |
|
11
|
4,567,984 M | NVDA | 68.10% | $111.61 | $187.62 |
|
12
|
209,427 M | SHOP | 66.11% | $97.01 | $161.14 |
|
13
|
145,057 M | KLAC | 62.88% | $676.31 | $1,101.55 |
|
14
|
400,654 M | ASML | 54.82% | $666.72 | $1,032.22 |
|
15
|
1,429,250 M | TSLA | 53.23% | $280.52 | $429.83 |
|
16
|
2,967,263 M | GOOGL | 52.11% | $161.30 | $245.35 |
|
17
|
2,980,566 M | GOOG | 51.39% | $162.79 | $246.45 |
|
18
|
112,466 M | CEG | 49.62% | $240.62 | $360.00 |
|
19
|
410,581 M | PLTR | 48.94% | $116.20 | $173.07 |
|
20
|
173,294 M | AMAT | 46.03% | $148.96 | $217.53 |
|
21
|
35,910 M | MCHP | 44.72% | $45.98 | $66.54 |
|
22
|
52,946 M | DDOG | 42.80% | $106.32 | $151.82 |
|
23
|
74,330 M | MRVL | 41.46% | $60.95 | $86.22 |
|
24
|
50,041 M | EA | 38.31% | $145.10 | $200.69 |
|
25
|
115,864 M | DASH | 38.24% | $196.20 | $271.22 |
|
26
|
48,347 M | ZS | 34.51% | $227.06 | $305.41 |
|
27
|
47,815 M | BKR | 34.01% | $36.19 | $48.50 |
|
28
|
50,498 M | IDXX | 33.90% | $471.38 | $631.19 |
|
29
|
161,686 M | ARM | 32.27% | $115.40 | $152.64 |
|
30
|
23,441 M | BIIB | 32.21% | $120.93 | $159.88 |
|
31
|
67,133 M | CSX | 28.10% | $28.11 | $36.01 |
|
32
|
190,588 M | PDD | 26.69% | $105.97 | $134.25 |
|
33
|
57,707 M | NXPI | 25.87% | $181.84 | $228.89 |
|
34
|
182,545 M | QCOM | 25.12% | $135.21 | $169.18 |
|
35
|
119,048 M | ADI | 24.90% | $193.74 | $241.99 |
|
36
|
20,150 M | ON | 24.42% | $39.60 | $49.27 |
|
37
|
1,785,027 M | META | 24.18% | $572.21 | $710.56 |
|
38
|
3,845,549 M | MSFT | 21.61% | $425.40 | $517.35 |
|
39
|
264,505 M | AZN | 20.99% | $70.51 | $85.31 |
|
40
|
3,829,117 M | AAPL | 20.95% | $213.32 | $258.02 |
|
41
|
54,949 M | FAST | 18.65% | $40.35 | $47.88 |
|
42
|
268,501 M | CSCO | 16.86% | $58.12 | $67.92 |
|
43
|
67,926 M | ADSK | 16.60% | $273.49 | $318.90 |
|
44
|
94,628 M | CDNS | 15.86% | $299.73 | $347.27 |
|
45
|
2,341,055 M | AMZN | 15.41% | $190.20 | $219.51 |
|
46
|
56,171 M | AXON | 15.20% | $621.10 | $715.51 |
|
47
|
47,468 M | XEL | 14.01% | $70.40 | $80.26 |
|
48
|
163,936 M | TXN | 13.94% | $158.26 | $180.32 |
|
49
|
122,938 M | CRWD | 13.43% | $431.88 | $489.88 |
|
50
|
34,954 M | GEHC | 13.14% | $67.67 | $76.56 |
|
51
|
65,587 M | MNST | 12.85% | $59.52 | $67.17 |
|
52
|
88,914 M | ORLY | 11.66% | $93.85 | $104.79 |
|
53
|
140,241 M | PANW | 11.23% | $186.27 | $207.19 |
|
54
|
35,926 M | CSGP | 10.73% | $76.58 | $84.80 |
|
55
|
49,643 M | ROST | 9.87% | $138.93 | $152.64 |
|
56
|
72,634 M | MAR | 9.68% | $243.95 | $267.57 |
|
57
|
47,534 M | TTWO | 9.57% | $235.17 | $257.68 |
|
58
|
42,691 M | FANG | 9.37% | $134.83 | $147.47 |
|
59
|
51,507 M | PCAR | 9.26% | $89.78 | $98.09 |
|
60
|
139,827 M | GILD | 9.14% | $103.25 | $112.69 |
|
61
|
189,571 M | INTU | 9.11% | $623.19 | $679.94 |
|
62
|
194,382 M | PEP | 6.31% | $133.55 | $141.98 |
|
63
|
175,598 M | BKNG | 6.21% | $5,101.43 | $5,418.05 |
|
64
|
60,999 M | AEP | 6.06% | $107.54 | $114.06 |
|
65
|
66,160 M | PYPL | 5.87% | $65.41 | $69.25 |
|
66
|
98,234 M | SBUX | 5.38% | $82.01 | $86.42 |
|
67
|
160,373 M | AMGN | 4.97% | $283.78 | $297.89 |
|
68
|
218,854 M | LIN | 4.17% | $448.05 | $466.73 |
|
69
|
87,148 M | SNPS | 2.14% | $459.36 | $469.17 |
|
70
|
19,874 M | GFS | 1.79% | $35.18 | $35.81 |
|
71
|
490,076 M | NFLX | 1.75% | $1,133.47 | $1,153.32 |
|
72
|
63,592 M | REGN | 1.69% | $590.00 | $600.00 |
|
73
|
132,725 M | HON | -0.80% | $210.74 | $209.05 |
|
74
|
20,874 M | CDW | -1.93% | $162.40 | $159.27 |
|
75
|
39,790 M | CCEP | -1.98% | $89.54 | $87.77 |
|
76
|
118,007 M | ADP | -2.47% | $298.69 | $291.31 |
|
77
|
45,793 M | EXC | -2.70% | $46.60 | $45.34 |
|
78
|
25,205 M | TTD | -2.85% | $53.06 | $51.55 |
|
79
|
73,603 M | ABNB | -3.06% | $124.01 | $120.22 |
|
80
|
81,642 M | CTAS | -3.31% | $209.55 | $202.61 |
|
81
|
63,140 M | WDAY | -4.11% | $246.61 | $236.48 |
|
82
|
26,294 M | DXCM | -4.57% | $70.26 | $67.05 |
|
83
|
110,153 M | MELI | -5.31% | $2,294.52 | $2,172.75 |
|
84
|
29,703 M | ODFL | -6.13% | $150.56 | $141.33 |
|
85
|
259,150 M | TMUS | -6.77% | $247.00 | $230.27 |
|
86
|
145,145 M | ADBE | -7.44% | $374.63 | $346.74 |
|
87
|
81,092 M | MDLZ | -7.66% | $67.87 | $62.67 |
|
88
|
99,786 M | MSTR | -7.85% | $381.60 | $351.63 |
|
89
|
405,730 M | COST | -8.37% | $999.04 | $915.38 |
|
90
|
30,845 M | KHC | -8.56% | $28.50 | $26.06 |
|
91
|
114,089 M | CMCSA | -8.63% | $33.82 | $30.90 |
|
92
|
33,045 M | CTSH | -10.06% | $75.23 | $67.66 |
|
93
|
53,802 M | ROP | -10.34% | $557.59 | $499.95 |
|
94
|
162,157 M | ISRG | -12.54% | $517.18 | $452.35 |
|
95
|
44,846 M | PAYX | -15.01% | $146.61 | $124.61 |
|
96
|
34,795 M | VRSK | -15.44% | $294.51 | $249.04 |
|
97
|
68,946 M | TRI | -17.64% | $185.74 | $152.98 |
|
98
|
65,738 M | FTNT | -17.68% | $104.21 | $85.79 |
|
99
|
103,402 M | VRTX | -19.16% | $498.86 | $403.30 |
|
100
|
35,102 M | KDP | -24.09% | $34.04 | $25.84 |
|
101
|
43,654 M | CPRT | -25.44% | $60.50 | $45.11 |
|
102
|
38,247 M | CHTR | -26.89% | $383.00 | $280.01 |
|
103
|
39,479 M | TEAM | -34.30% | $229.07 | $150.49 |
|
104
|
20,822 M | LULU | -34.63% | $268.60 | $175.59 |
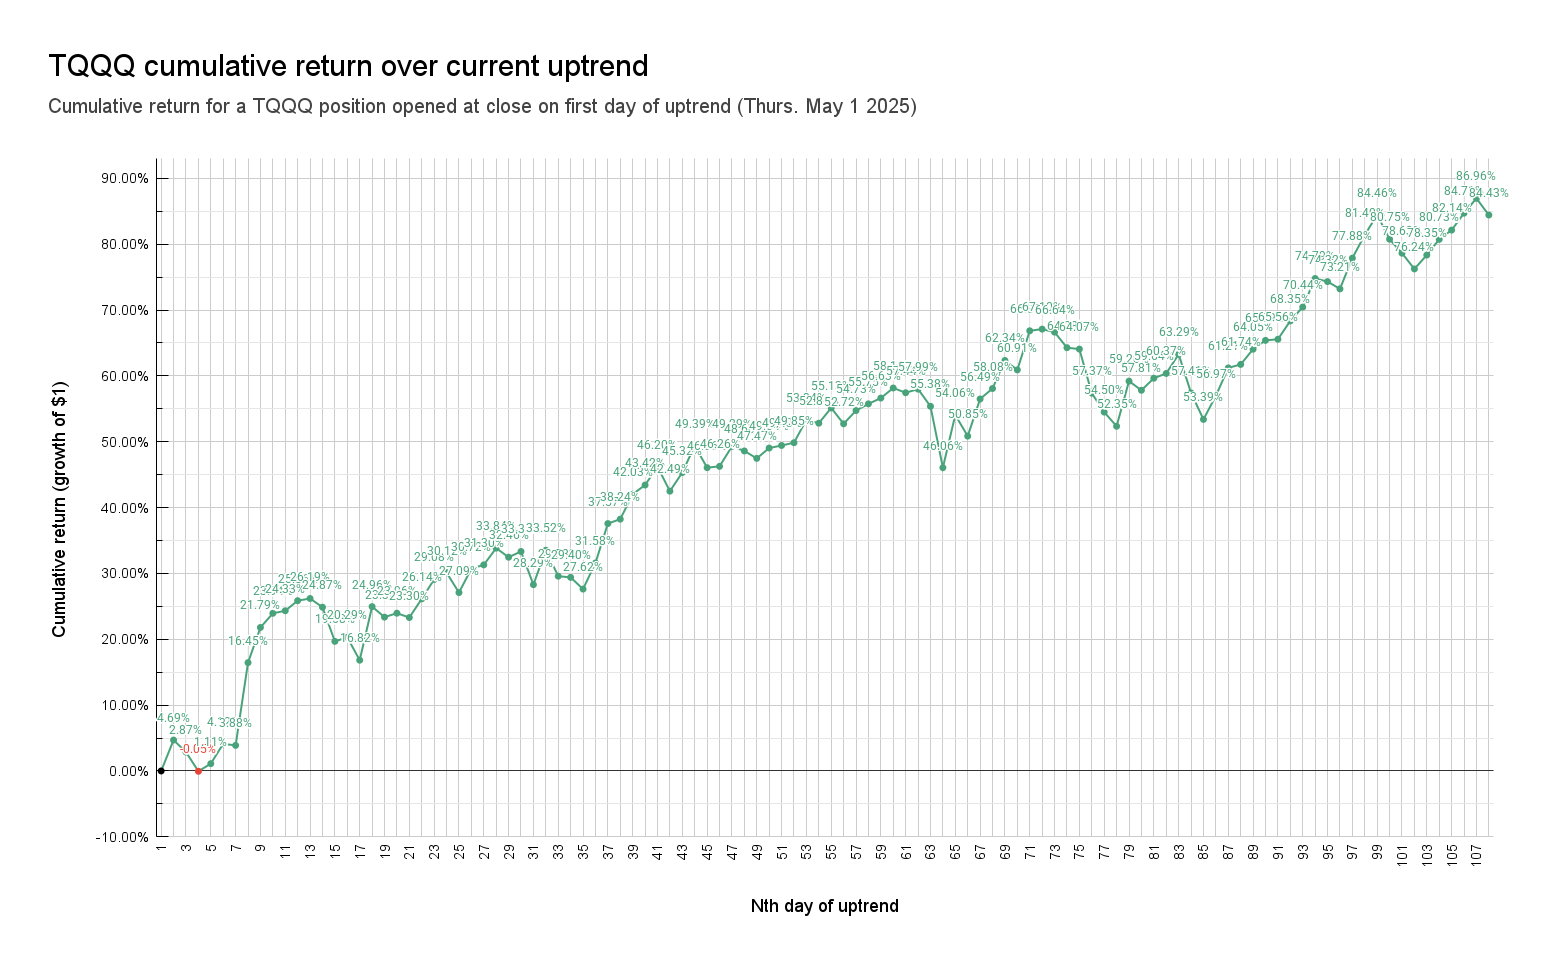
Assuming 3% for the risk-free rate, the Sharpe Ratio for this investment is 3.80.
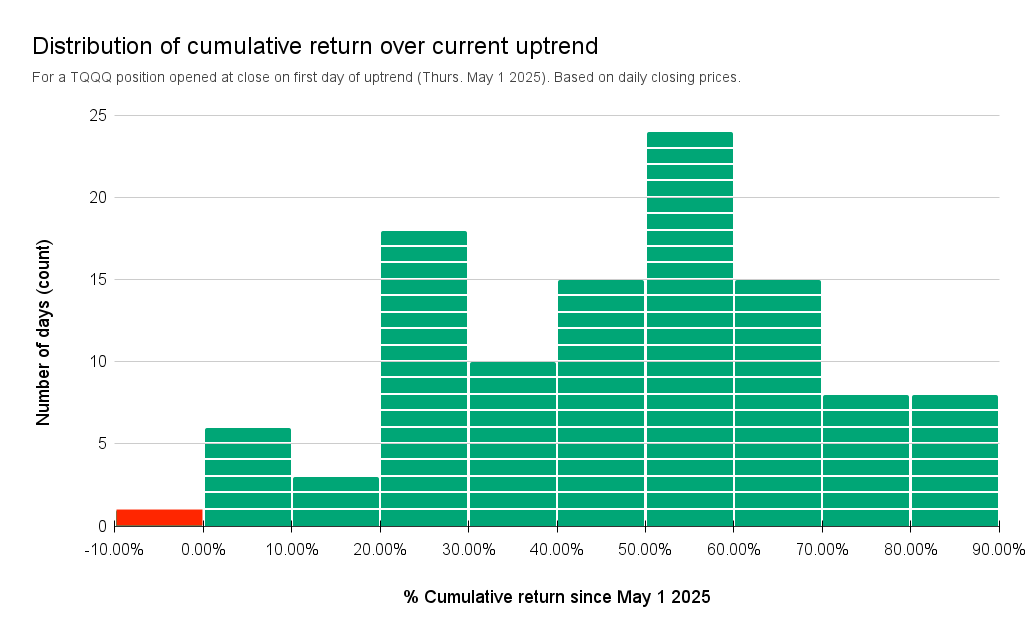
For a TQQQ position opened at close on day 📈1 of current uptrend (Thurs. May 1st 2025):
- Up +50% or more more than half of the time (55 of 108 days, or 50.92% of the uptrend)
- In the red just 1 in 108 days (less than 1% of the time), for a loss of -0.05%
In other words, if you entered a TQQQ position when the Market Signal indicated an uptrend, and held til now - more than half the days since then offered to close the position a return greater than +50%.