Mar. 14th 2025
Downtrend continues, SQQQ outperforms QQQ and its holdings
Market Signal: -3 WEAK BEARISH
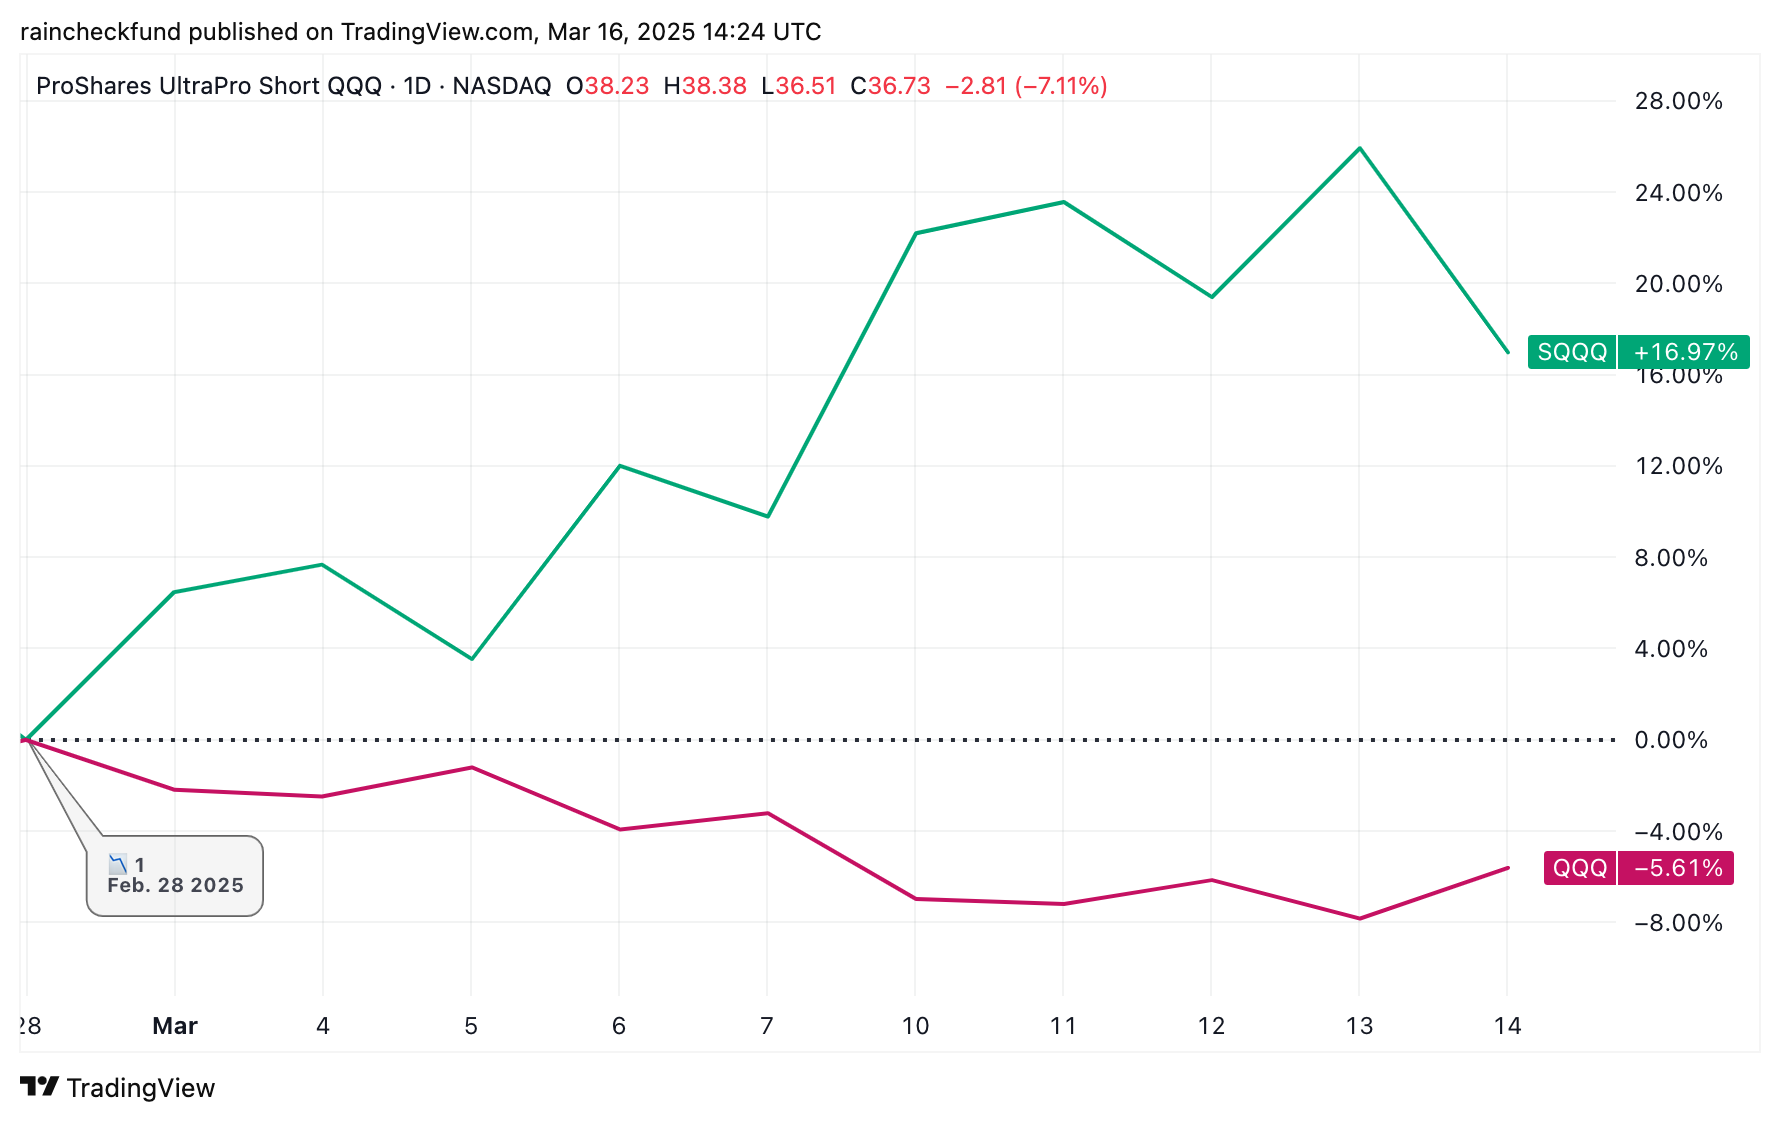
The downtrend continued this week; the Market Signal remained -3 WEAK BEARISH, and the the NASDAQ-100 (QQQ) fell -2.47% since last Friday's close.
Over the course of this downtrend, as QQQ has fallen, SQQQ (the inverse triple leveraged (-3x) ETF for the NASDAQ-100) has climbed.
SQQQ is up +6.56% from last Friday's close, and +16.97% since day 📉1 of current downtrend (Feb. 28th 2025). SQQQ is outperforming QQQ and all of its holdings over this timeframe.
SQQQ vs QQQ over the current downtrendAn SQQQ position opened after market close on day 📉1 of current downtrend (per Raincheck Fund's strategy) would have seen zero days in the red, and on Thurs. March 13th would be up +25.92% (10 days after opening position).
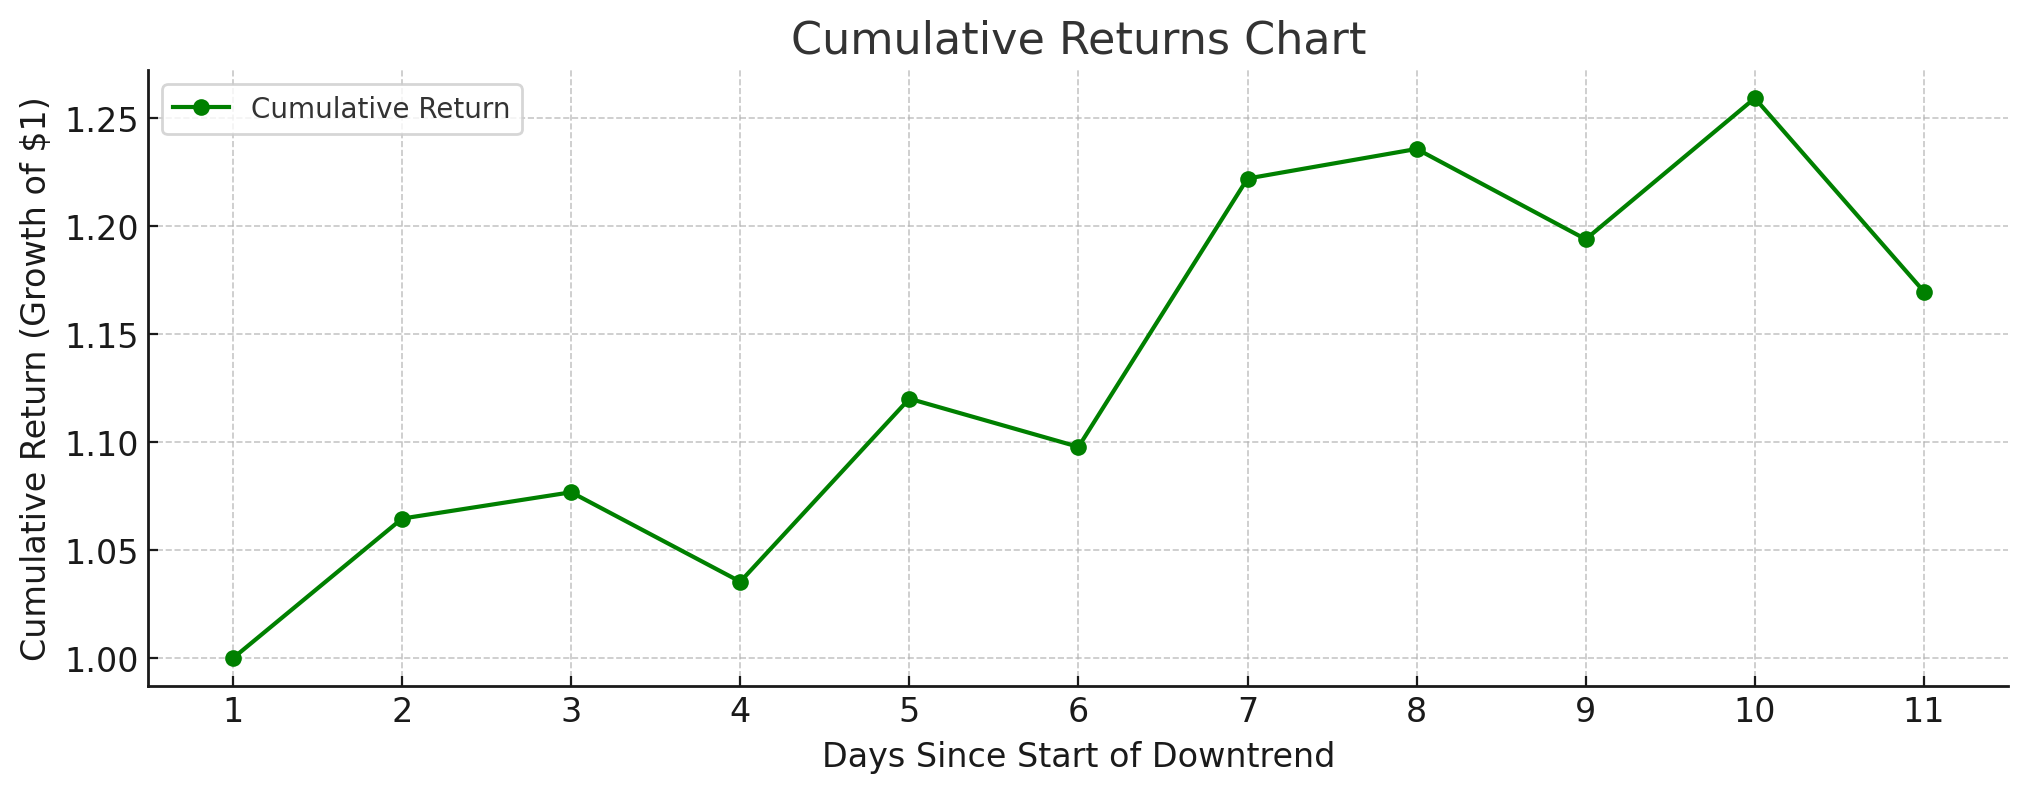
SQQQ position opened after market close on day 📉1 of current downtrendNASDAQ-100 52-week lows
The following NASDAQ-100 (QQQ) holdings closed at a 52-week low today:
ODFL $162.5 -0.29%
SQQQ (the inverse triple-leveraged (-3x) ETF for the NASDAQ-100) will be used in place of TQQQ in the next two sections benchmarking against QQQ and its holdings.📉11th day of downtrend
Day 📉1 of current downtrend occurred on Fri. Feb. 28th 2025.
QQQ-5.61% since start of current downtrendSQQQ+16.97% since start of current downtrend
| A | B | C | D | E | F | G | |
|---|---|---|---|---|---|---|---|
|
1
|
Market Signal | Trend Count | QQQ Close | QQQ %chg since 📉1 | SQQQ close | SQQQ %chg since 📉1 | Date |
|
2
|
-2 | 📉1 | $508.17 | 0.00% | $31.40 | 0.00% | Fri 2/28/25 |
|
3
|
-3 | 📉2 | $497.05 | -2.19% | $33.43 | 6.46% | Mon 3/3/25 |
|
4
|
-3 | 📉3 | $495.55 | -2.48% | $33.81 | 7.68% | Tue 3/4/25 |
|
5
|
-3 | 📉4 | $502.01 | -1.21% | $32.51 | 3.54% | Wed 3/5/25 |
|
6
|
-3 | 📉5 | $488.20 | -3.93% | $35.17 | 12.01% | Thu 3/6/25 |
|
7
|
-3 | 📉6 | $491.79 | -3.22% | $34.47 | 9.78% | Fri 3/7/25 |
|
8
|
-3 | 📉7 | $472.73 | -6.97% | $38.37 | 22.20% | Mon 3/10/25 |
|
9
|
-3 | 📉8 | $471.60 | -7.20% | $38.80 | 23.57% | Tue 3/11/25 |
|
10
|
-3 | 📉9 | $476.92 | -6.15% | $37.49 | 19.39% | Wed 3/12/25 |
|
11
|
-3 | 📉10 | $468.34 | -7.84% | $39.54 | 25.92% | Thu 3/13/25 |
|
12
|
-3 | 📉11 | $479.66 | -5.61% | $36.73 | 16.97% | Fri 3/14/25 |
Market Signal, Trend Count, closing prices, and return (%) over current downtrend
SQQQ vs QQQ Holdings
SQQQ is outperforming 100% of QQQ holdings since day 📉1 of current downtrend (Feb. 28th 2025).
Among TQQQ, SQQQ, QQQ, and all of QQQ's holdings - none have outperformed SQQQ between day 📉1 of current downtrend and now.
This a good example of why Raincheck Fund focuses on triple-leveraged (+/-3x) ETF's for the NASDAQ-100 (QQQ). During uptrends TQQQ outperforms most of QQQ holdings. Conversely, during downtrends SQQQ outperforms most of QQQ holdings.
QQQ is -5.61% while SQQQ is +16.47% over the current downtrend. SQQQ has outperformed QQQ by +22.18% during this time.
| A | B | C | D | E | |
|---|---|---|---|---|---|
|
1
|
Market Cap | Symbol | %Chg since 📉1 | Close on 📉1 | Close |
|
2
|
173,997 M | QQQ | -5.61% | $508.17 | $479.66 |
|
3
|
1,267 M | SQQQ | 16.97% | $31.40 | $36.73 |
|
4
|
77,472 M | MSTR | 16.47% | $255.43 | $297.49 |
|
5
|
170,180 M | PDD | 7.78% | $113.69 | $122.54 |
|
6
|
112,297 M | MU | 7.65% | $93.63 | $100.79 |
|
7
|
36,150 M | EA | 7.43% | $129.12 | $138.71 |
|
8
|
42,622 M | AXON | 5.26% | $528.45 | $556.26 |
|
9
|
129,620 M | VRTX | 5.21% | $479.79 | $504.77 |
|
10
|
33,205 M | CSGP | 3.25% | $76.25 | $78.73 |
|
11
|
101,011 M | LRCX | 2.54% | $76.74 | $78.69 |
|
12
|
168,527 M | AMGN | 1.83% | $308.06 | $313.71 |
|
13
|
240,586 M | AZN | 1.82% | $76.21 | $77.60 |
|
14
|
202,264 M | PLTR | 1.55% | $84.92 | $86.24 |
|
15
|
104,137 M | INTC | 1.35% | $23.73 | $24.05 |
|
16
|
163,620 M | AMD | 1.11% | $99.86 | $100.97 |
|
17
|
53,611 M | MNST | 0.81% | $54.65 | $55.09 |
|
18
|
30,606 M | ZS | 0.81% | $196.23 | $197.81 |
|
19
|
280,745 M | ASML | 0.69% | $709.08 | $714.00 |
|
20
|
94,748 M | KLAC | 0.59% | $708.84 | $713.00 |
|
21
|
45,573 M | KDP | 0.21% | $33.52 | $33.59 |
|
22
|
83,187 M | MDLZ | 0.12% | $64.23 | $64.31 |
|
23
|
44,421 M | EXC | -0.02% | $44.20 | $44.19 |
|
24
|
173,177 M | QCOM | -0.38% | $157.17 | $156.58 |
|
25
|
56,337 M | AEP | -0.46% | $106.05 | $105.56 |
|
26
|
43,158 M | FAST | -0.62% | $75.73 | $75.26 |
|
27
|
20,411 M | BIIB | -0.75% | $140.50 | $139.44 |
|
28
|
67,823 M | CDNS | -1.23% | $250.50 | $247.43 |
|
29
|
133,962 M | CMCSA | -1.25% | $35.88 | $35.43 |
|
30
|
126,465 M | AMAT | -1.52% | $158.07 | $155.66 |
|
31
|
36,125 M | KHC | -1.56% | $30.71 | $30.23 |
|
32
|
136,138 M | HON | -1.61% | $212.89 | $209.47 |
|
33
|
919,419 M | AVGO | -1.95% | $199.43 | $195.54 |
|
34
|
2,888,548 M | MSFT | -2.12% | $396.99 | $388.56 |
|
35
|
68,996 M | SNPS | -2.42% | $457.28 | $446.23 |
|
36
|
167,402 M | INTU | -2.45% | $613.84 | $598.80 |
|
37
|
215,411 M | LIN | -2.47% | $467.05 | $455.50 |
|
38
|
138,781 M | GILD | -2.51% | $114.31 | $111.44 |
|
39
|
2,968,748 M | NVDA | -2.60% | $124.92 | $121.67 |
|
40
|
61,133 M | ROP | -2.60% | $584.50 | $569.29 |
|
41
|
2,043,288 M | GOOG | -2.67% | $172.22 | $167.62 |
|
42
|
20,852 M | GFS | -2.68% | $38.77 | $37.73 |
|
43
|
2,017,323 M | GOOGL | -2.81% | $170.28 | $165.49 |
|
44
|
40,481 M | VRSK | -2.81% | $296.91 | $288.58 |
|
45
|
68,208 M | PYPL | -2.96% | $71.05 | $68.95 |
|
46
|
28,283 M | ANSS | -3.17% | $333.25 | $322.68 |
|
47
|
203,791 M | PEP | -3.18% | $153.47 | $148.59 |
|
48
|
40,075 M | XEL | -3.26% | $72.10 | $69.75 |
|
49
|
38,370 M | CCEP | -3.32% | $86.26 | $83.40 |
|
50
|
49,918 M | CHTR | -3.32% | $363.57 | $351.50 |
|
51
|
76,024 M | ORLY | -3.37% | $1,373.64 | $1,327.41 |
|
52
|
36,106 M | TTWO | -3.50% | $211.98 | $204.57 |
|
53
|
42,416 M | BKR | -3.92% | $44.59 | $42.84 |
|
54
|
50,865 M | CPRT | -3.92% | $54.80 | $52.65 |
|
55
|
52,368 M | PAYX | -4.11% | $151.67 | $145.44 |
|
56
|
120,727 M | PANW | -4.25% | $190.43 | $182.34 |
|
57
|
52,286 M | NXPI | -4.37% | $215.59 | $206.16 |
|
58
|
72,905 M | REGN | -4.56% | $698.74 | $666.87 |
|
59
|
102,478 M | MELI | -4.74% | $2,121.87 | $2,021.37 |
|
60
|
33,776 M | IDXX | -4.99% | $437.11 | $415.30 |
|
61
|
39,134 M | CTSH | -5.05% | $83.33 | $79.12 |
|
62
|
292,264 M | TMUS | -5.08% | $269.69 | $255.98 |
|
63
|
43,474 M | FANG | -5.51% | $158.96 | $150.20 |
|
64
|
240,687 M | CSCO | -5.63% | $64.11 | $60.50 |
|
65
|
37,485 M | GEHC | -6.16% | $87.35 | $81.97 |
|
66
|
56,857 M | CSX | -6.25% | $32.01 | $30.01 |
|
67
|
22,126 M | CDW | -6.29% | $178.20 | $167.00 |
|
68
|
392,681 M | NFLX | -6.38% | $980.56 | $918.00 |
|
69
|
2,097,821 M | AMZN | -6.75% | $212.28 | $197.95 |
|
70
|
77,819 M | CTAS | -7.07% | $207.50 | $192.84 |
|
71
|
54,194 M | ADSK | -7.21% | $274.21 | $254.43 |
|
72
|
64,949 M | WDAY | -7.28% | $263.34 | $244.17 |
|
73
|
118,709 M | ADP | -7.43% | $315.18 | $291.76 |
|
74
|
52,066 M | PCAR | -7.49% | $107.24 | $99.21 |
|
75
|
77,088 M | DASH | -7.53% | $198.44 | $183.50 |
|
76
|
34,539 M | ODFL | -7.93% | $176.50 | $162.50 |
|
77
|
18,201 M | ON | -8.20% | $47.05 | $43.19 |
|
78
|
1,539,451 M | META | -9.07% | $668.20 | $607.60 |
|
79
|
28,773 M | MCHP | -9.11% | $58.86 | $53.50 |
|
80
|
87,682 M | CRWD | -9.22% | $389.66 | $353.74 |
|
81
|
103,535 M | ADI | -9.26% | $230.06 | $208.75 |
|
82
|
171,671 M | ADBE | -9.99% | $438.56 | $394.74 |
|
83
|
160,528 M | TXN | -9.99% | $195.99 | $176.42 |
|
84
|
99,570 M | APP | -10.08% | $325.74 | $292.89 |
|
85
|
124,309 M | ARM | -10.44% | $131.69 | $117.94 |
|
86
|
74,014 M | FTNT | -10.89% | $108.01 | $96.25 |
|
87
|
146,536 M | BKNG | -10.98% | $5,016.01 | $4,465.48 |
|
88
|
25,014 M | WBD | -11.08% | $11.46 | $10.19 |
|
89
|
40,981 M | ROST | -11.48% | $140.32 | $124.21 |
|
90
|
76,338 M | ABNB | -11.53% | $138.87 | $122.86 |
|
91
|
3,207,062 M | AAPL | -11.72% | $241.84 | $213.49 |
|
92
|
34,893 M | DDOG | -12.66% | $116.55 | $101.80 |
|
93
|
67,024 M | MAR | -13.31% | $280.45 | $243.11 |
|
94
|
67,719 M | CEG | -13.60% | $250.55 | $216.46 |
|
95
|
401,054 M | COST | -13.80% | $1,048.61 | $903.92 |
|
96
|
804,065 M | TSLA | -14.68% | $292.98 | $249.98 |
|
97
|
37,878 M | LULU | -14.93% | $365.61 | $311.03 |
|
98
|
111,446 M | SBUX | -15.28% | $115.81 | $98.11 |
|
99
|
172,779 M | ISRG | -15.48% | $573.15 | $484.44 |
|
100
|
27,624 M | DXCM | -20.01% | $88.37 | $70.69 |
|
101
|
57,231 M | TEAM | -23.15% | $284.26 | $218.44 |
|
102
|
26,759 M | TTD | -23.29% | $70.32 | $53.94 |
|
103
|
59,533 M | MRVL | -25.14% | $91.82 | $68.74 |
|
104
|
14,916 M | MDB | -30.68% | $267.43 | $185.37 |