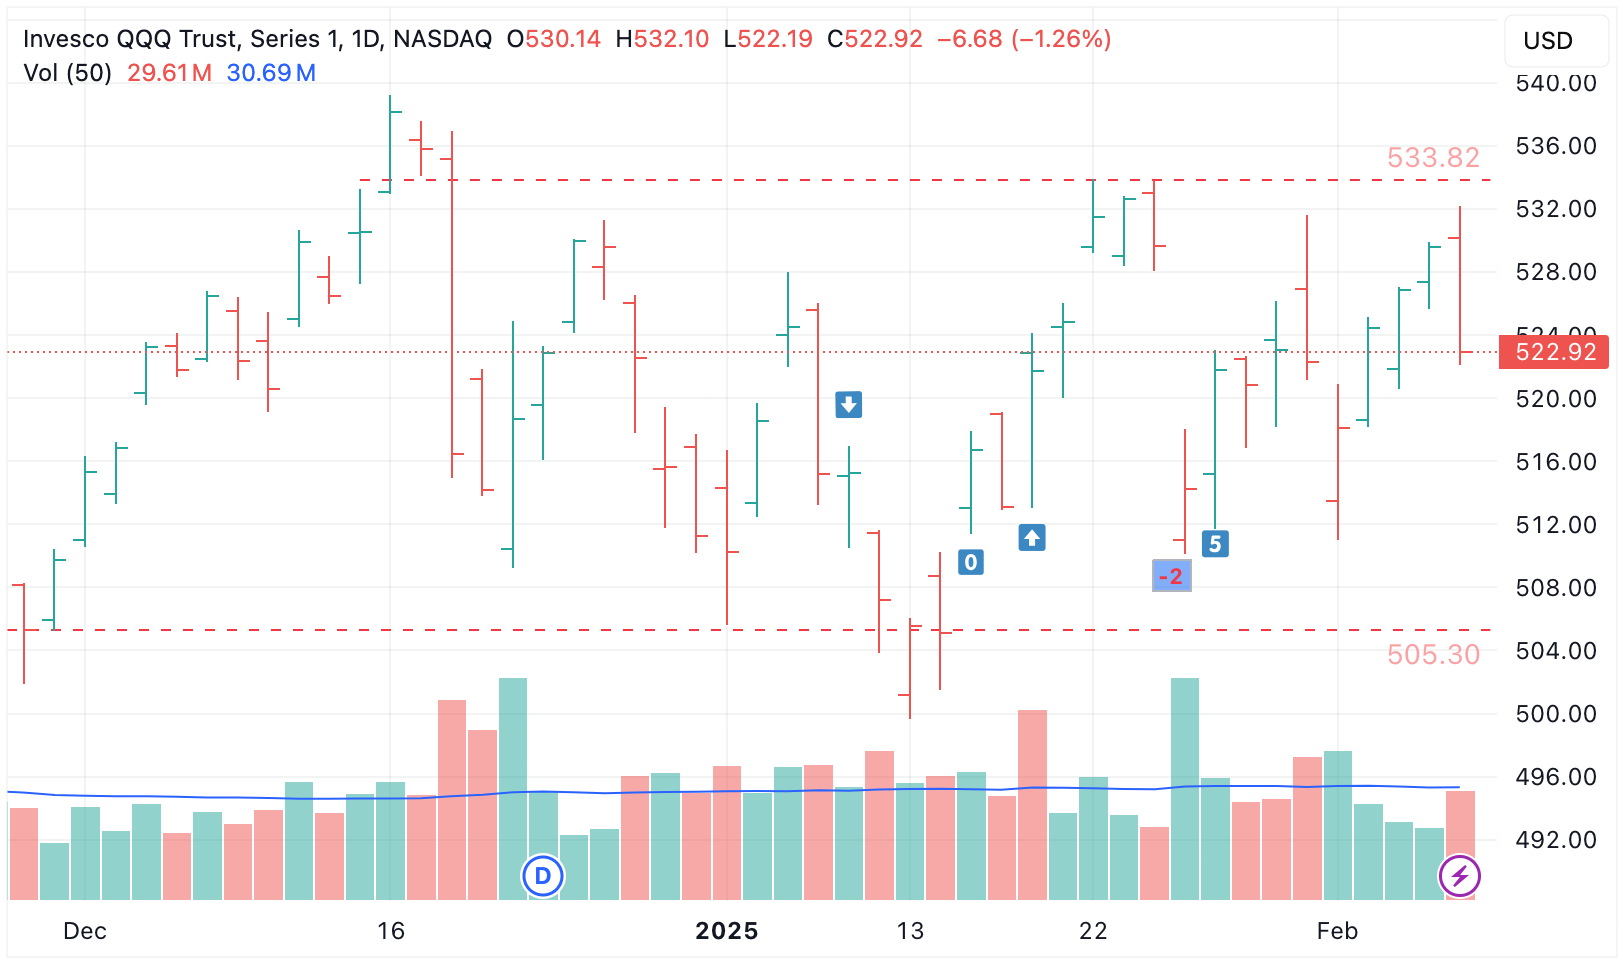
Feb. 7th 2025
Consolidation and sideways price action
Market Signal: +5 MODERATE BULLISH
The NASDAQ-100 (QQQ) continued to consolidate and trade sideways, closing up +0.12% for the week. However, some signs of strengths were displayed, and the Market Signal remained in MODERATE BULLISH territory.
Besides Mon. Feb. 3rd, every day this week saw 10% or more of NASDAQ-100 (QQQ) holdings closing at 52-week highs. On Wed. Feb. 5th, 17 QQQ holdings closed at 52-week highs.
AMZN and GOOG/GOOGL closed at all-time highs on Tues. Feb. 4th. NFLX closed at an all-time high on Thurs. Feb. 6th, while META closed at an all-time high on Fri. Feb. 7th; both are showing strength.
These 4 companies make up 18.05% (almost 1/5th) of the index, and their price action influences the index proportionally.
NASDAQ-100 52-week highs
The following NASDAQ-100 (QQQ) holdings closed at a 52-week high today:
META $714.52 +0.36%CRWD $421.59 +0.26%MAR $303.97 +0.34%FTNT $107.66 +2.81%EXC $41.31 +0.46%TTWO $208.77 +14.03%
📈15th day of uptrend
Day 📈1 of current uptrend occurred on Jan. 17th 2025.
QQQ+0.23% since start of current uptrendTQQQ-0.49% since start of current uptrend
| A | B | C | D | E | F | G | |
|---|---|---|---|---|---|---|---|
|
1
|
Market Signal | Trend Count | QQQ Close | QQQ %chg since 📈1 | TQQQ close | TQQQ %chg since 📈1 | Date |
|
2
|
1 | 📈1 | $521.74 | 0.00% | $83.14 | 0.00% | Fri 1/17/25 |
|
3
|
1 | 📈2 | $524.80 | 0.59% | $84.54 | 1.68% | Tue 1/21/25 |
|
4
|
1 | 📈3 | $531.51 | 1.87% | $87.80 | 5.61% | Wed 1/22/25 |
|
5
|
1 | 📈4 | $532.64 | 2.09% | $88.34 | 6.25% | Thu 1/23/25 |
|
6
|
1 | 📈5 | $529.63 | 1.51% | $86.75 | 4.34% | Fri 1/24/25 |
|
7
|
-2 | 📈6* | $514.21 | -1.44% | $79.14 | -4.81% | Mon 1/27/25 |
|
8
|
5 | 📈7 | $521.81 | 0.01% | $82.65 | -0.59% | Tue 1/28/25 |
|
9
|
4 | 📈8 | $520.83 | -0.17% | $82.14 | -1.20% | Wed 1/29/25 |
|
10
|
4 | 📈9 | $523.05 | 0.25% | $83.17 | 0.04% | Thu 1/30/25 |
|
11
|
4 | 📈10 | $522.29 | 0.11% | $82.72 | -0.51% | Fri 1/31/25 |
|
12
|
3 | 📈11 | $518.11 | -0.70% | $80.72 | -2.91% | Mon 2/3/25 |
|
13
|
6 | 📈12 | $524.47 | 0.52% | $83.65 | 0.61% | Tue 2/4/25 |
|
14
|
6 | 📈13 | $526.85 | 0.98% | $84.74 | 1.92% | Wed 2/5/25 |
|
15
|
6 | 📈14 | $529.60 | 1.51% | $86.01 | 3.45% | Thu 2/6/25 |
|
16
|
5 | 📈15 | $522.92 | 0.23% | $82.73 | -0.49% | Fri 2/7/25 |
Market Signal, Trend Count, closing prices, and return (%) over current uptrend.
*Uptrend persists, as a new downtrend calls for consecutive days of negative Market Signal values, which did not occur.
TQQQ vs QQQ Holdings
TQQQ is outperforming 40% of QQQ holdings since day 📈1 of current uptrend (Jan. 17th 2025). Given the index's mostly sideways action thus far, this uptrend is largely undeveloped, and as such TQQQ is not yet atop the leaderboard.
PLTR , TEAM, NFLX, CRWD, SBUX, META are beginning to emerge as leaders during this uptrend. These same 6 stocks were also atop the leaderboard last week, and NFLX and PLTR have led the way since the start of the uptrend. The table below helps to identify these winning stocks that are contributing most to the index's upward price action.
| A | B | C | D | E | |
|---|---|---|---|---|---|
|
1
|
Market Cap | Symbol | %Chg since 📈1 | Close on 📈1 | Close |
|
2
|
189,689 M | QQQ | 0.23% | $521.74 | $522.92 |
|
3
|
252,519 M | PLTR | 54.45% | $71.77 | $110.85 |
|
4
|
82,341 M | TEAM | 24.54% | $252.36 | $314.28 |
|
5
|
433,716 M | NFLX | 18.16% | $858.10 | $1,013.93 |
|
6
|
103,842 M | CRWD | 18.09% | $357.00 | $421.59 |
|
7
|
127,451 M | SBUX | 17.94% | $95.13 | $112.20 |
|
8
|
1,810,350 M | META | 16.60% | $612.77 | $714.52 |
|
9
|
51,795 M | AXON | 14.37% | $593.89 | $679.24 |
|
10
|
82,516 M | FTNT | 14.25% | $94.23 | $107.66 |
|
11
|
281,143 M | TMUS | 12.45% | $218.97 | $246.24 |
|
12
|
81,227 M | DASH | 12.07% | $174.48 | $195.54 |
|
13
|
36,847 M | TTWO | 12.00% | $186.41 | $208.77 |
|
14
|
120,864 M | VRTX | 11.21% | $422.00 | $469.32 |
|
15
|
42,669 M | CTSH | 10.78% | $77.81 | $86.20 |
|
16
|
463,346 M | COST | 10.67% | $943.19 | $1,043.81 |
|
17
|
22,267 M | MDB | 9.78% | $253.11 | $277.87 |
|
18
|
126,089 M | APP | 9.75% | $342.34 | $375.72 |
|
19
|
84,471 M | MAR | 9.67% | $277.18 | $303.97 |
|
20
|
37,649 M | IDXX | 9.66% | $419.26 | $459.78 |
|
21
|
61,417 M | ROP | 9.66% | $522.32 | $572.76 |
|
22
|
31,536 M | ZS | 9.57% | $187.58 | $205.53 |
|
23
|
127,263 M | PANW | 9.50% | $177.11 | $193.94 |
|
24
|
72,323 M | WDAY | 8.91% | $249.64 | $271.89 |
|
25
|
171,286 M | ARM | 8.88% | $149.26 | $162.51 |
|
26
|
101,225 M | MELI | 8.75% | $1,836.00 | $1,996.65 |
|
27
|
158,695 M | PDD | 8.24% | $105.57 | $114.27 |
|
28
|
75,690 M | ORLY | 8.22% | $1,216.79 | $1,316.75 |
|
29
|
223,253 M | AZN | 8.09% | $66.60 | $71.99 |
|
30
|
157,787 M | AMGN | 7.88% | $272.11 | $293.54 |
|
31
|
24,924 M | WBD | 6.72% | $9.52 | $10.16 |
|
32
|
48,482 M | LULU | 6.53% | $373.70 | $398.10 |
|
33
|
41,478 M | VRSK | 5.45% | $278.55 | $293.73 |
|
34
|
41,510 M | EXC | 4.79% | $39.42 | $41.31 |
|
35
|
31,669 M | CSGP | 4.60% | $73.85 | $77.25 |
|
36
|
119,691 M | GILD | 4.57% | $91.84 | $96.04 |
|
37
|
34,404 M | DXCM | 4.38% | $84.38 | $88.08 |
|
38
|
216,676 M | LIN | 4.37% | $436.00 | $455.05 |
|
39
|
77,621 M | REGN | 4.17% | $681.58 | $710.00 |
|
40
|
42,102 M | ODFL | 4.04% | $189.55 | $197.20 |
|
41
|
36,890 M | CCEP | 3.84% | $77.07 | $80.03 |
|
42
|
40,040 M | GEHC | 3.42% | $84.74 | $87.64 |
|
43
|
248,006 M | CSCO | 3.39% | $60.23 | $62.27 |
|
44
|
64,900 M | ADSK | 3.33% | $291.45 | $301.15 |
|
45
|
124,490 M | ADP | 3.31% | $296.18 | $305.97 |
|
46
|
53,443 M | AEP | 3.19% | $97.25 | $100.35 |
|
47
|
48,461 M | DDOG | 3.07% | $138.40 | $142.65 |
|
48
|
105,684 M | LRCX | 2.53% | $80.30 | $82.33 |
|
49
|
56,087 M | CPRT | 2.30% | $56.90 | $58.21 |
|
50
|
185,764 M | QCOM | 2.07% | $164.56 | $167.96 |
|
51
|
81,540 M | CTAS | 1.89% | $198.31 | $202.06 |
|
52
|
25,589 M | CDW | 1.74% | $188.73 | $192.02 |
|
53
|
2,428,470 M | AMZN | 1.42% | $225.94 | $229.15 |
|
54
|
75,607 M | MDLZ | 1.02% | $57.86 | $58.45 |
|
55
|
188,519 M | ADBE | 0.72% | $429.99 | $433.07 |
|
56
|
20,597 M | BIIB | 0.57% | $140.55 | $141.35 |
|
57
|
52,836 M | PAYX | 0.31% | $146.29 | $146.74 |
|
58
|
35,429 M | KHC | 0.10% | $29.27 | $29.30 |
|
59
|
84,332 M | ABNB | -0.10% | $135.12 | $134.98 |
|
60
|
81,280 M | SNPS | -0.17% | $526.70 | $525.82 |
|
61
|
38,245 M | XEL | -0.18% | $66.72 | $66.60 |
|
62
|
62,847 M | CSX | -0.43% | $32.73 | $32.59 |
|
63
|
42,184 M | TQQQ | -0.49% | $83.14 | $82.73 |
|
64
|
45,743 M | BKR | -0.73% | $46.54 | $46.20 |
|
65
|
161,759 M | BKNG | -0.80% | $4,926.80 | $4,887.47 |
|
66
|
49,375 M | CHTR | -1.00% | $351.37 | $347.84 |
|
67
|
3,419,474 M | AAPL | -1.02% | $229.98 | $227.63 |
|
68
|
54,117 M | NXPI | -1.13% | $215.36 | $212.93 |
|
69
|
99,359 M | KLAC | -1.29% | $757.47 | $747.70 |
|
70
|
30,158 M | ANSS | -1.45% | $349.93 | $344.86 |
|
71
|
207,924 M | ISRG | -1.63% | $592.64 | $582.98 |
|
72
|
42,104 M | KDP | -1.83% | $31.62 | $31.04 |
|
73
|
82,191 M | CDNS | -1.94% | $305.60 | $299.68 |
|
74
|
96,914 M | CEG | -2.08% | $316.36 | $309.79 |
|
75
|
198,291 M | PEP | -2.48% | $148.25 | $144.58 |
|
76
|
42,341 M | FAST | -2.94% | $76.08 | $73.84 |
|
77
|
286,132 M | ASML | -3.79% | $756.33 | $727.70 |
|
78
|
55,597 M | PCAR | -3.91% | $110.33 | $106.02 |
|
79
|
162,030 M | INTU | -4.18% | $604.13 | $578.85 |
|
80
|
47,045 M | ROST | -4.40% | $149.15 | $142.59 |
|
81
|
3,046,074 M | MSFT | -4.49% | $429.03 | $409.75 |
|
82
|
2,281,237 M | GOOG | -5.27% | $197.55 | $187.14 |
|
83
|
1,054,046 M | AVGO | -5.29% | $237.44 | $224.87 |
|
84
|
2,259,295 M | GOOGL | -5.44% | $196.00 | $185.34 |
|
85
|
3,179,782 M | NVDA | -5.71% | $137.71 | $129.84 |
|
86
|
57,891 M | TTD | -5.73% | $124.42 | $117.29 |
|
87
|
45,290 M | MNST | -5.77% | $49.42 | $46.57 |
|
88
|
129,954 M | CMCSA | -6.04% | $36.58 | $34.37 |
|
89
|
21,822 M | ON | -6.19% | $54.63 | $51.25 |
|
90
|
146,286 M | AMAT | -6.27% | $192.05 | $180.00 |
|
91
|
101,814 M | ADI | -6.37% | $219.16 | $205.21 |
|
92
|
164,199 M | TXN | -6.45% | $192.42 | $180.00 |
|
93
|
133,639 M | HON | -7.66% | $222.58 | $205.52 |
|
94
|
33,515 M | EA | -9.44% | $142.00 | $128.60 |
|
95
|
27,907 M | MCHP | -10.49% | $57.97 | $51.89 |
|
96
|
21,250 M | GFS | -10.79% | $43.10 | $38.45 |
|
97
|
82,703 M | INTC | -11.12% | $21.49 | $19.10 |
|
98
|
95,719 M | MRVL | -11.33% | $124.76 | $110.62 |
|
99
|
174,299 M | AMD | -11.44% | $121.46 | $107.56 |
|
100
|
46,172 M | FANG | -12.24% | $180.18 | $158.13 |
|
101
|
102,838 M | MU | -12.72% | $105.75 | $92.30 |
|
102
|
1,163,157 M | TSLA | -15.21% | $426.50 | $361.62 |
|
103
|
76,478 M | PYPL | -15.79% | $91.81 | $77.31 |
|
104
|
82,660 M | MSTR | -17.39% | $396.50 | $327.56 |