Jan. 31st 2025
DeepSeek tremors
Market Signal: +4 MODERATE BULLISH
DeepSeek dominated headlines and sent the market reeling at the start of this week.
On Monday January 27 2025 QQQ and TQQQ were down -2.91% and -8.77% respectively, and the Market Signal flashed negative coming in at -1 WEAK BULLISH. A downtrend did not ensue, as the next day QQQ made up ground and the Market Signal was +5 MODERATE BULLISH (a new downtrend calls for consecutive days of negative Market Signal values).
The Market Signal was MODERATE BULLISH for the remainder of the week, ending at +4 with two of the Magnificent Seven closing at 52-week highs.
NASDAQ-100 52-week highs
The following NASDAQ-100 (QQQ) holdings closed at a 52-week high today:
GOOG $205.60 +1.47%GOOGL $204.02 +1.57%META $689.18 +0.32%PLTR $82.49 +1.56%TEAM $306.78 +14.92%DASH $188.83 +0.14%
Monday's downward action is largely due to QQQ's concentration in tech stocks, particularly the Magnificent Seven, all of which are heavily invested in AI.
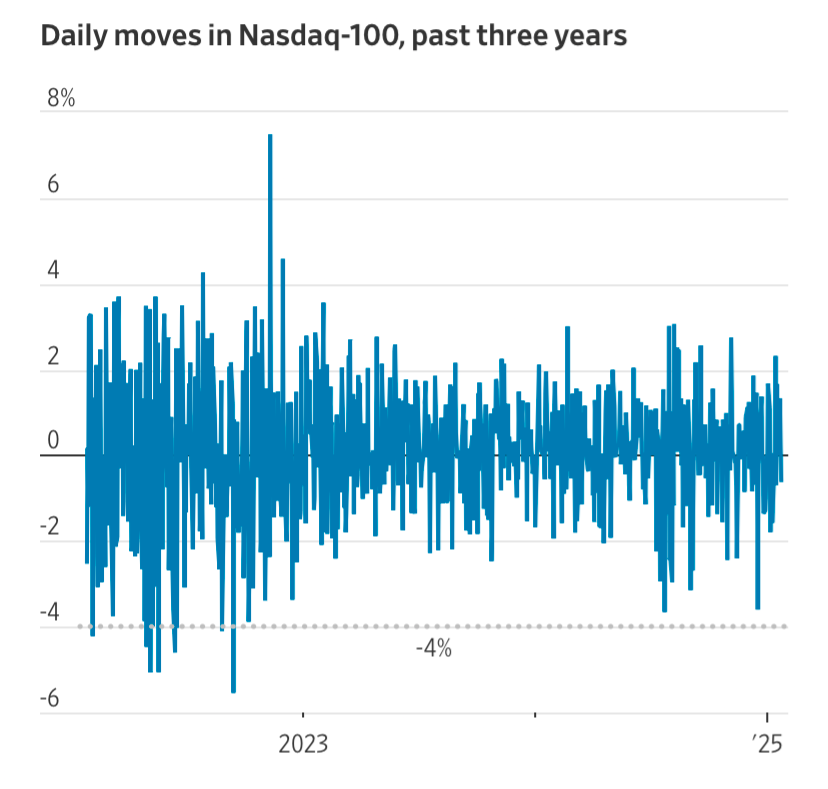
However, Monday's action was far from the worst day for the index. In fact, the selloff on December 18 2024 (33 trading days ago) was worse (TQQQ was -10.81%).
The Nasdaq-100 last fell more than 4% in September 2022,
📈10th day of uptrend
Day 📈1 of current uptrend occurred on Jan 17 2025.
QQQ+0.11% since start of current uptrendTQQQ-0.51% since start of current uptrend
| A | B | C | D | E | F | G | |
|---|---|---|---|---|---|---|---|
|
1
|
Market Signal | Trend Count | QQQ Close | QQQ %chg since 📈1 | TQQQ close | TQQQ %chg since 📈1 | Date |
|
2
|
1 | 📈1 | $521.74 | 0.00% | $83.14 | 0.00% | Fri 1/17/25 |
|
3
|
1 | 📈2 | $524.80 | 0.59% | $84.54 | 1.68% | Tue 1/21/25 |
|
4
|
1 | 📈3 | $531.51 | 1.87% | $87.80 | 5.61% | Wed 1/22/25 |
|
5
|
1 | 📈4 | $532.64 | 2.09% | $88.34 | 6.25% | Thu 1/23/25 |
|
6
|
1 | 📈5 | $529.63 | 1.51% | $86.75 | 4.34% | Fri 1/24/25 |
|
7
|
-2 | 📈6* | $514.21 | -1.44% | $79.14 | -4.81% | Mon 1/27/25 |
|
8
|
5 | 📈7 | $521.81 | 0.01% | $82.65 | -0.59% | Tue 1/28/25 |
|
9
|
4 | 📈8 | $520.83 | -0.17% | $82.14 | -1.20% | Wed 1/29/25 |
|
10
|
4 | 📈9 | $523.05 | 0.25% | $83.17 | 0.04% | Thu 1/30/25 |
|
11
|
4 | 📈10 | $522.29 | 0.11% | $82.72 | -0.51% | Fri 1/31/25 |
Market Signal, Trend Count, closing prices, and return (%) over current uptrend.
*Uptrend persists, as a new downtrend calls for consecutive days of negative Market Signal values, which did not occur.
TQQQ vs QQQ Holdings
TQQQ is outperforming 32% of QQQ holdings since day 📈1 of current uptrend (Jan 17 2025).
| A | B | C | D | E | |
|---|---|---|---|---|---|
|
1
|
Market Cap | Symbol | %Chg since 📈1 | Close on 📈1 | Close |
|
2
|
189,461 M | QQQ | 0.11% | $521.74 | $522.29 |
|
3
|
79,896 M | TEAM | 21.56% | $252.36 | $306.78 |
|
4
|
187,914 M | PLTR | 14.94% | $71.77 | $82.49 |
|
5
|
417,816 M | NFLX | 13.83% | $858.10 | $976.76 |
|
6
|
122,317 M | SBUX | 13.19% | $95.13 | $107.68 |
|
7
|
1,746,147 M | META | 12.47% | $612.77 | $689.18 |
|
8
|
98,049 M | CRWD | 11.50% | $357.00 | $398.07 |
|
9
|
50,443 M | LULU | 10.84% | $373.70 | $414.20 |
|
10
|
61,726 M | ROP | 10.21% | $522.32 | $575.65 |
|
11
|
49,732 M | AXON | 9.81% | $593.89 | $652.18 |
|
12
|
25,611 M | WBD | 9.66% | $9.52 | $10.44 |
|
13
|
118,896 M | VRTX | 9.40% | $422.00 | $461.68 |
|
14
|
78,439 M | DASH | 8.22% | $174.48 | $188.83 |
|
15
|
31,085 M | ZS | 8.00% | $187.58 | $202.59 |
|
16
|
21,902 M | MDB | 7.98% | $253.11 | $273.32 |
|
17
|
124,031 M | APP | 7.96% | $342.34 | $369.59 |
|
18
|
77,320 M | FTNT | 7.06% | $94.23 | $100.88 |
|
19
|
167,687 M | ARM | 6.89% | $149.26 | $159.55 |
|
20
|
67,096 M | ADSK | 6.82% | $291.45 | $311.34 |
|
21
|
266,653 M | TMUS | 6.39% | $218.97 | $232.97 |
|
22
|
74,728 M | ORLY | 6.38% | $1,216.79 | $1,294.42 |
|
23
|
219,433 M | AZN | 6.25% | $66.60 | $70.76 |
|
24
|
40,960 M | CTSH | 6.17% | $77.81 | $82.61 |
|
25
|
155,417 M | PDD | 6.01% | $105.57 | $111.91 |
|
26
|
121,137 M | GILD | 5.84% | $91.84 | $97.20 |
|
27
|
26,538 M | CDW | 5.52% | $188.73 | $199.14 |
|
28
|
2,499,208 M | AMZN | 5.20% | $225.94 | $237.68 |
|
29
|
191,155 M | QCOM | 5.09% | $164.56 | $172.93 |
|
30
|
69,708 M | WDAY | 4.98% | $249.64 | $262.06 |
|
31
|
153,423 M | AMGN | 4.89% | $272.11 | $285.42 |
|
32
|
80,753 M | MAR | 4.84% | $277.18 | $290.59 |
|
33
|
97,450 M | MELI | 4.69% | $1,836.00 | $1,922.19 |
|
34
|
40,342 M | GEHC | 4.20% | $84.74 | $88.30 |
|
35
|
121,016 M | PANW | 4.13% | $177.11 | $184.42 |
|
36
|
2,497,409 M | GOOGL | 4.09% | $196.00 | $204.02 |
|
37
|
2,516,750 M | GOOG | 4.07% | $197.55 | $205.60 |
|
38
|
434,968 M | COST | 3.89% | $943.19 | $979.88 |
|
39
|
31,403 M | CSGP | 3.72% | $73.85 | $76.60 |
|
40
|
40,590 M | VRSK | 3.19% | $278.55 | $287.44 |
|
41
|
48,482 M | DDOG | 3.11% | $138.40 | $142.71 |
|
42
|
33,915 M | DXCM | 2.90% | $84.38 | $86.83 |
|
43
|
3,545,209 M | AAPL | 2.62% | $229.98 | $236.00 |
|
44
|
20,973 M | BIIB | 2.40% | $140.55 | $143.93 |
|
45
|
212,424 M | LIN | 2.32% | $436.00 | $446.12 |
|
46
|
123,286 M | ADP | 2.31% | $296.18 | $303.01 |
|
47
|
36,082 M | KHC | 1.95% | $29.27 | $29.84 |
|
48
|
36,207 M | CCEP | 1.92% | $77.07 | $78.55 |
|
49
|
55,817 M | CPRT | 1.81% | $56.90 | $57.93 |
|
50
|
190,426 M | ADBE | 1.73% | $429.99 | $437.45 |
|
51
|
206,745 M | PEP | 1.65% | $148.25 | $150.69 |
|
52
|
43,542 M | KDP | 1.52% | $31.62 | $32.10 |
|
53
|
40,193 M | EXC | 1.47% | $39.42 | $40.00 |
|
54
|
52,383 M | AEP | 1.14% | $97.25 | $98.36 |
|
55
|
80,939 M | CTAS | 1.14% | $198.31 | $200.57 |
|
56
|
49,674 M | ROST | 0.95% | $149.15 | $150.56 |
|
57
|
53,171 M | PAYX | 0.94% | $146.29 | $147.67 |
|
58
|
104,146 M | LRCX | 0.93% | $80.30 | $81.05 |
|
59
|
38,589 M | XEL | 0.72% | $66.72 | $67.20 |
|
60
|
34,559 M | IDXX | 0.67% | $419.26 | $422.05 |
|
61
|
241,355 M | CSCO | 0.61% | $60.23 | $60.60 |
|
62
|
145,473 M | HON | 0.51% | $222.58 | $223.72 |
|
63
|
58,145 M | PCAR | 0.50% | $110.33 | $110.88 |
|
64
|
63,387 M | CSX | 0.43% | $32.73 | $32.87 |
|
65
|
77,544 M | MDLZ | 0.22% | $57.86 | $57.99 |
|
66
|
30,651 M | ANSS | 0.16% | $349.93 | $350.50 |
|
67
|
81,228 M | SNPS | -0.23% | $526.70 | $525.48 |
|
68
|
168,373 M | INTU | -0.43% | $604.13 | $601.51 |
|
69
|
32,581 M | TTWO | -0.48% | $186.41 | $185.51 |
|
70
|
42,179 M | TQQQ | -0.51% | $83.14 | $82.72 |
|
71
|
45,696 M | BKR | -0.77% | $46.54 | $46.18 |
|
72
|
73,953 M | REGN | -1.26% | $681.58 | $672.98 |
|
73
|
47,371 M | MNST | -1.44% | $49.42 | $48.71 |
|
74
|
49,042 M | CHTR | -1.67% | $351.37 | $345.49 |
|
75
|
39,627 M | ODFL | -2.08% | $189.55 | $185.61 |
|
76
|
290,697 M | ASML | -2.25% | $756.33 | $739.31 |
|
77
|
98,747 M | KLAC | -2.54% | $757.47 | $738.24 |
|
78
|
81,626 M | CDNS | -2.61% | $305.60 | $297.62 |
|
79
|
81,951 M | ABNB | -2.92% | $135.12 | $131.17 |
|
80
|
53,004 M | NXPI | -3.16% | $215.36 | $208.55 |
|
81
|
3,085,549 M | MSFT | -3.26% | $429.03 | $415.06 |
|
82
|
105,128 M | ADI | -3.32% | $219.16 | $211.89 |
|
83
|
203,692 M | ISRG | -3.50% | $592.64 | $571.88 |
|
84
|
88,805 M | PYPL | -3.52% | $91.81 | $88.58 |
|
85
|
41,990 M | FAST | -3.73% | $76.08 | $73.24 |
|
86
|
22,919 M | GFS | -3.78% | $43.10 | $41.47 |
|
87
|
156,798 M | BKNG | -3.84% | $4,926.80 | $4,737.56 |
|
88
|
168,404 M | TXN | -4.06% | $192.42 | $184.61 |
|
89
|
22,286 M | ON | -4.19% | $54.63 | $52.34 |
|
90
|
188,165 M | AMD | -4.54% | $121.46 | $115.95 |
|
91
|
58,577 M | TTD | -4.61% | $124.42 | $118.68 |
|
92
|
1,301,403 M | TSLA | -5.13% | $426.50 | $404.60 |
|
93
|
93,845 M | CEG | -5.18% | $316.36 | $299.98 |
|
94
|
146,571 M | AMAT | -6.09% | $192.05 | $180.35 |
|
95
|
29,160 M | MCHP | -6.33% | $57.97 | $54.30 |
|
96
|
1,037,171 M | AVGO | -6.81% | $237.44 | $221.27 |
|
97
|
128,801 M | CMCSA | -7.98% | $36.58 | $33.66 |
|
98
|
47,991 M | FANG | -8.78% | $180.18 | $164.36 |
|
99
|
97,658 M | MRVL | -9.54% | $124.76 | $112.86 |
|
100
|
84,132 M | INTC | -9.59% | $21.49 | $19.43 |
|
101
|
2,940,514 M | NVDA | -12.81% | $137.71 | $120.07 |
|
102
|
32,236 M | EA | -13.44% | $142.00 | $122.91 |
|
103
|
101,657 M | MU | -13.72% | $105.75 | $91.24 |
|
104
|
84,484 M | MSTR | -15.56% | $396.50 | $334.79 |