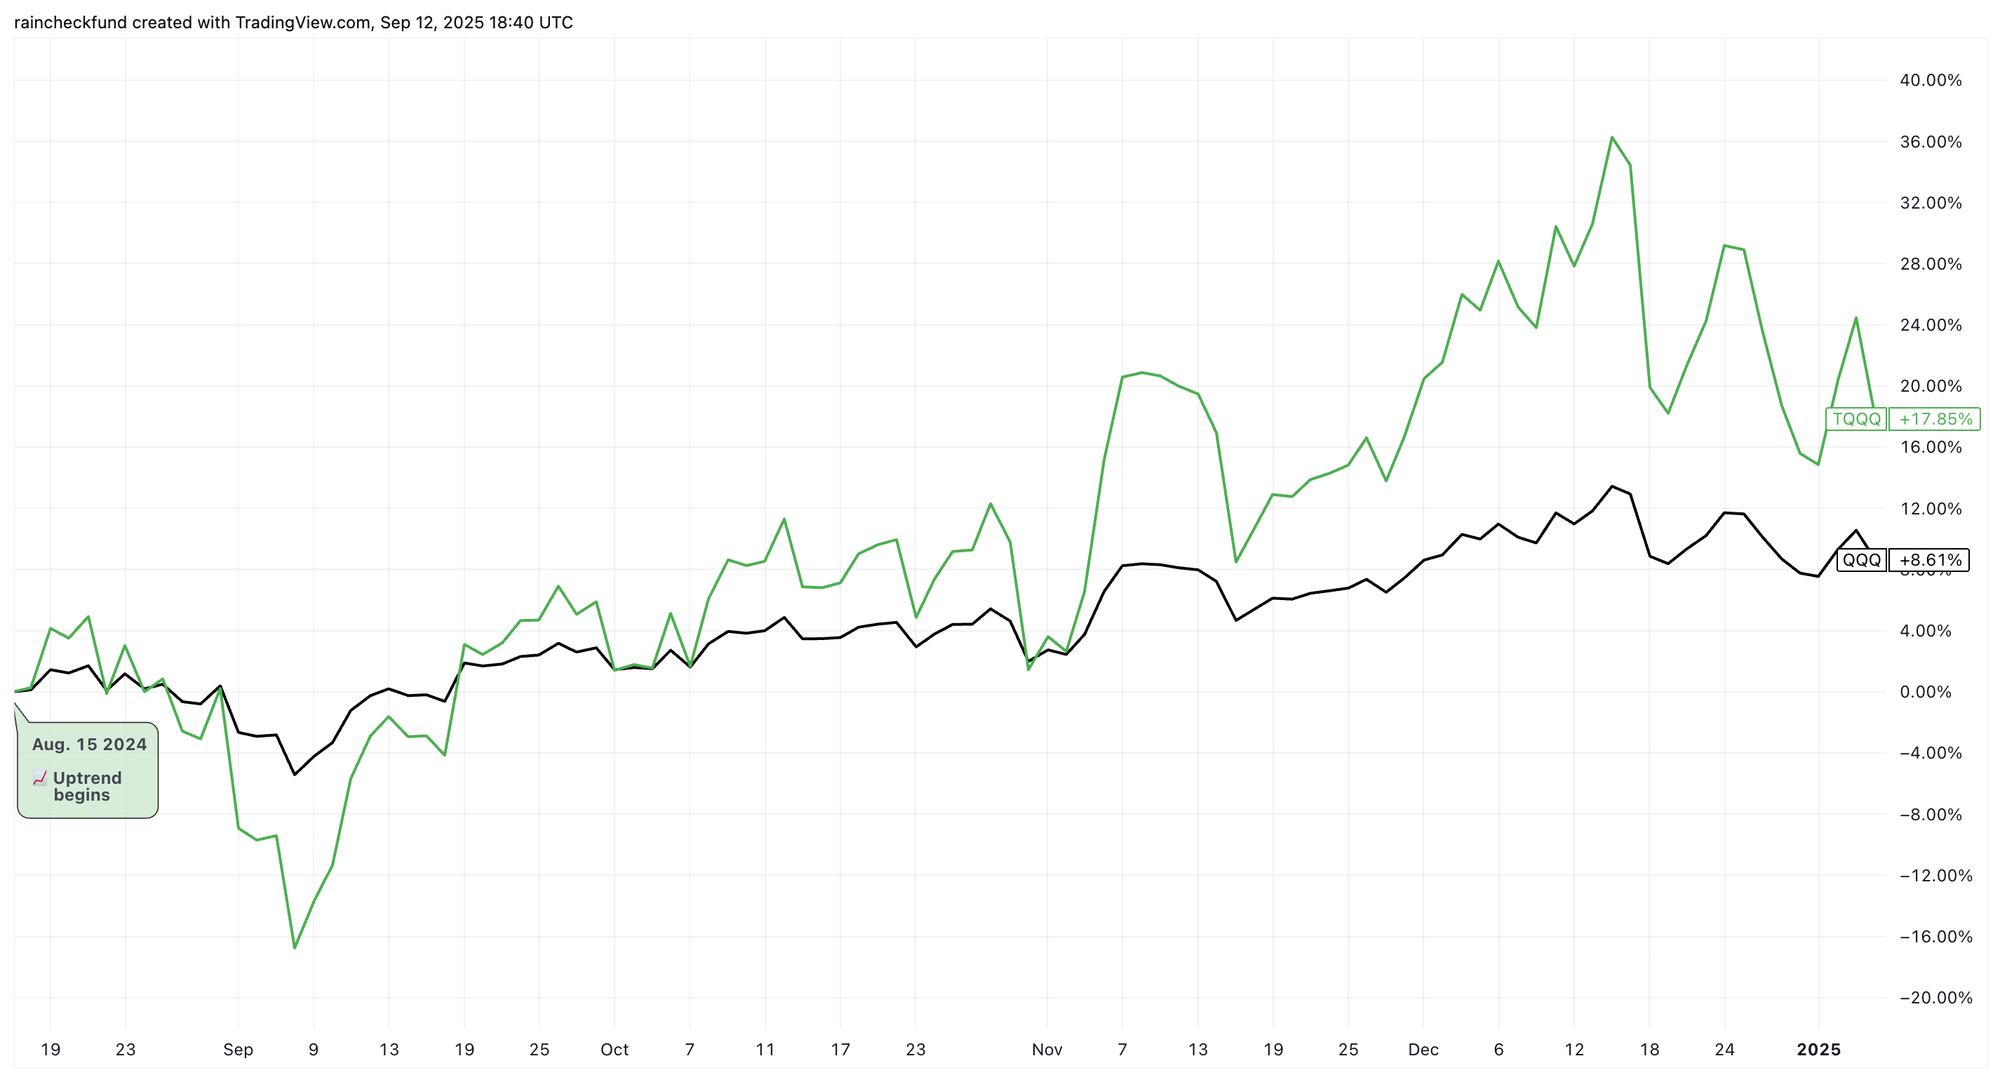
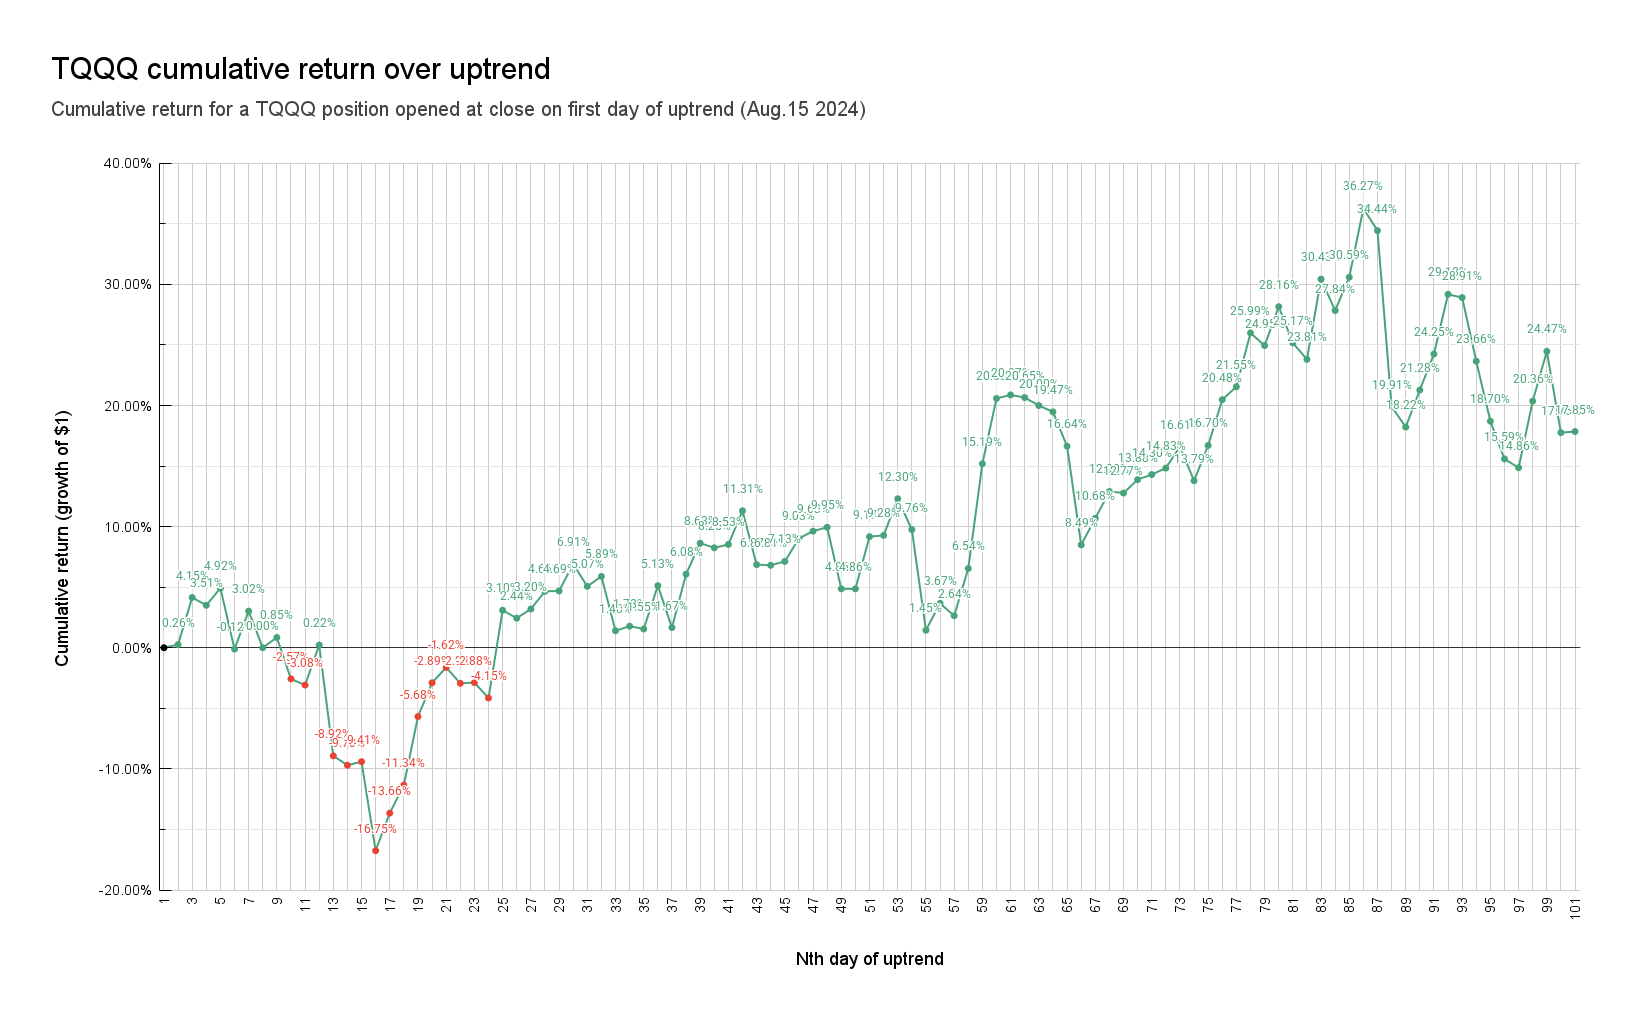
Aug. 15th 2024: 📈+17.85% return over 100 day uptrend; +36.27% at peak

Table of Contents
- Returns
- QQQ Benchmark
- Risk Management
- TQQQ vs QQQ holdings
- Cumulative Return & Sharpe Ratio
- Exit Opportunities (Distribution of Cumulative Return)
Returns
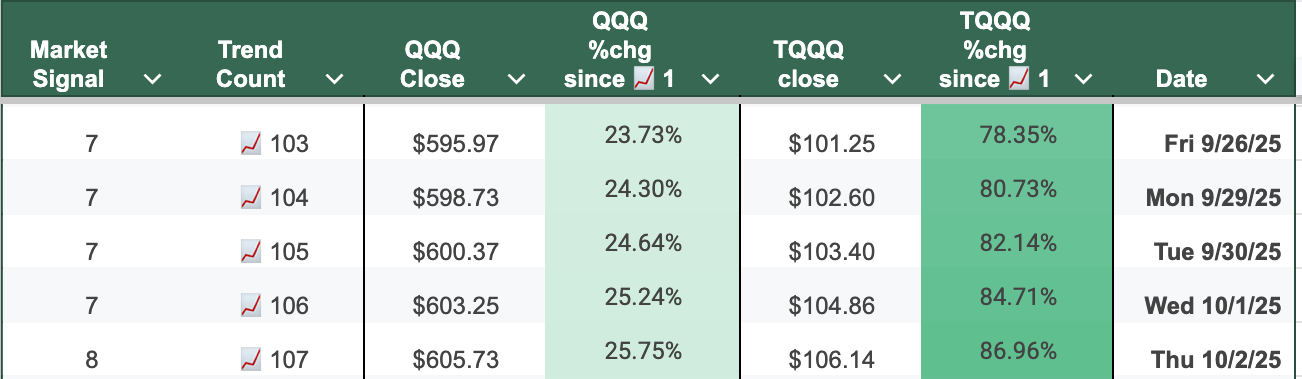
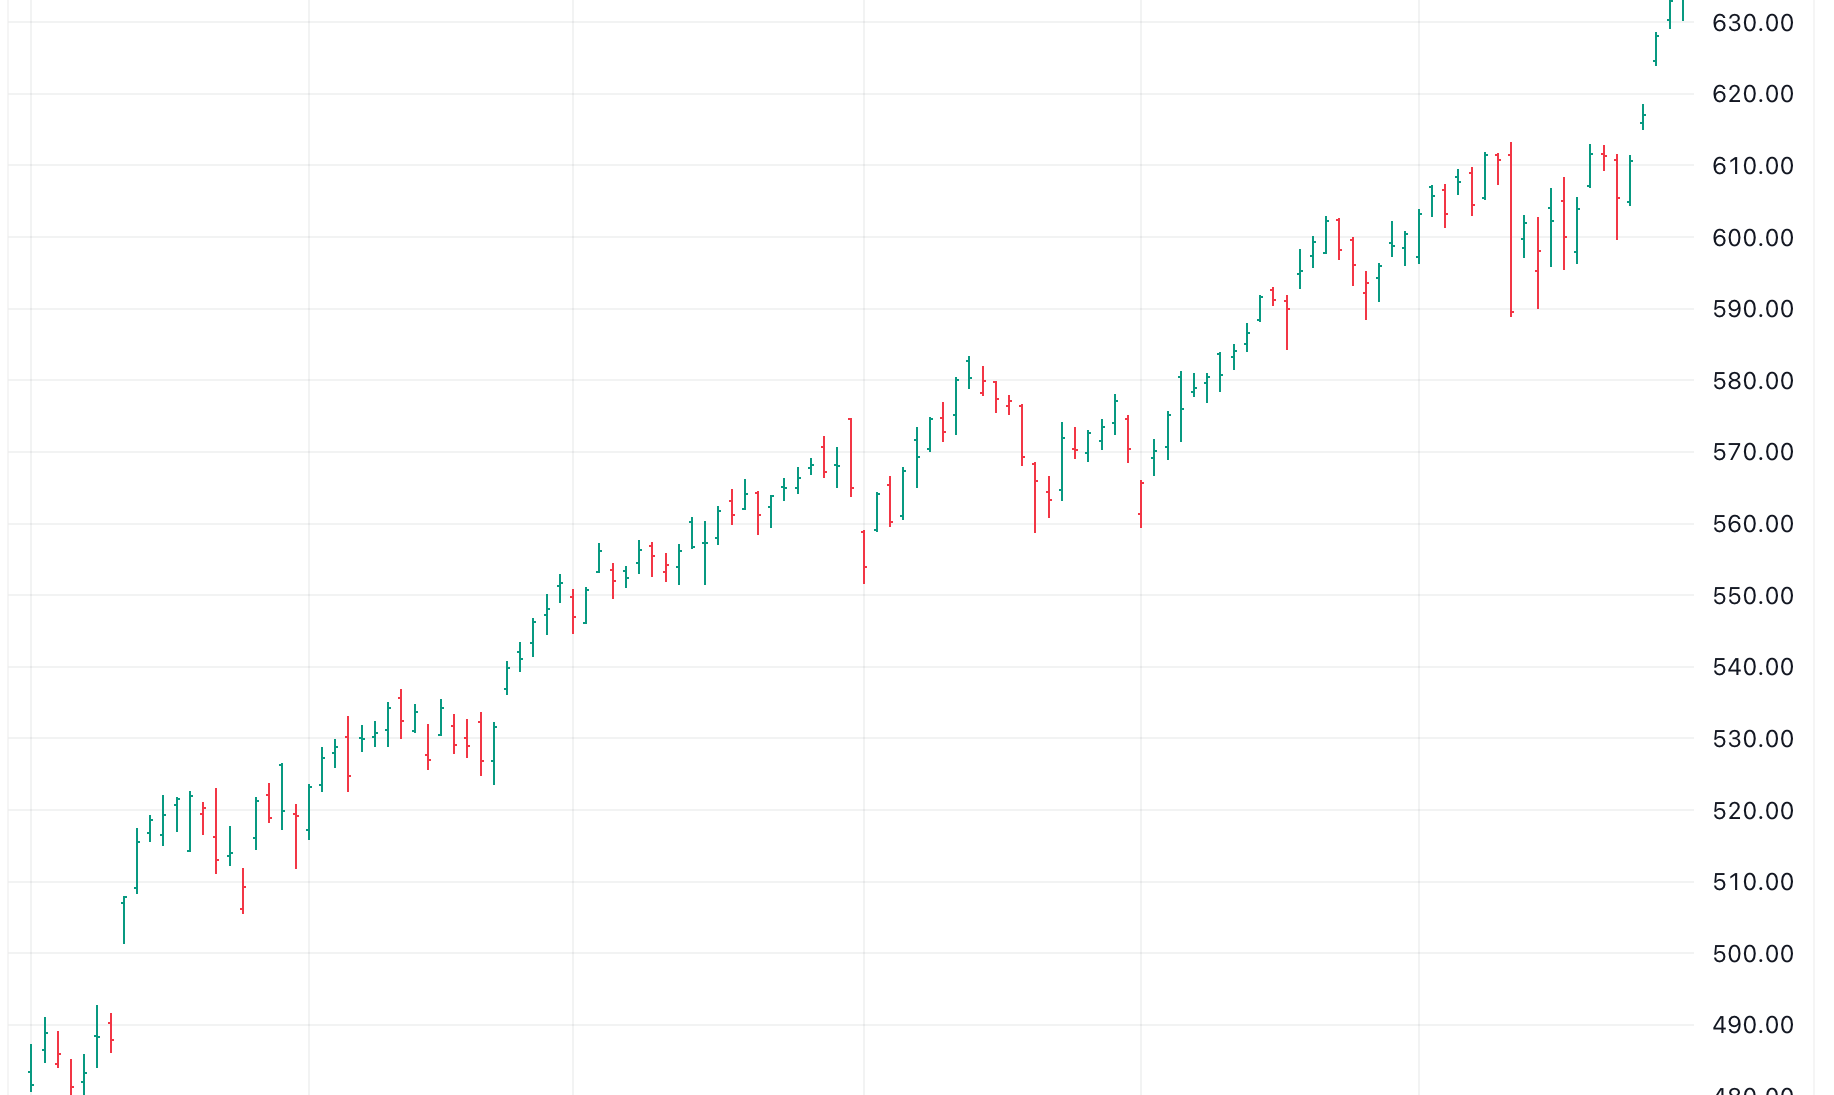
The uptrend began on Thurs. Aug. 15th 2024 and ended on Wed. Jan. 8th 2025, after 100 consecutive days of positive Market Signal values.
- The uptrend peaked on Mon. Dec. 16th 2024, with
TQQQ+36.27% since uptrend start - A
TQQQposition (opened at close on day 📈1 of uptrend, and closed on day 📉1 of downtrend) returned +17.85%
| A | B | C | D | E | F | G | |
|---|---|---|---|---|---|---|---|
|
1
|
Market Signal | Trend Count | QQQ Close | QQQ %chg since 📈1 | TQQQ close | TQQQ %chg since 📈1 | Date |
|
2
|
1 | 📈1 | $474.42 | 0.00% | $68.46 | 0.00% | Thu 8/15/24 |
|
3
|
3 | 📈2 | $475.02 | 0.13% | $68.64 | 0.26% | Fri 8/16/24 |
|
4
|
4 | 📈3 | $481.27 | 1.44% | $71.30 | 4.15% | Mon 8/19/24 |
|
5
|
3 | 📈4 | $480.26 | 1.23% | $70.86 | 3.51% | Tue 8/20/24 |
|
6
|
3 | 📈5 | $482.50 | 1.70% | $71.83 | 4.92% | Wed 8/21/24 |
|
7
|
7 | 📈6 | $474.85 | 0.09% | $68.38 | -0.12% | Thu 8/22/24 |
|
8
|
8 | 📈7 | $480.00 | 1.18% | $70.53 | 3.02% | Fri 8/23/24 |
|
9
|
7 | 📈8 | $475.34 | 0.19% | $68.46 | 0.00% | Mon 8/26/24 |
|
10
|
8 | 📈9 | $476.76 | 0.49% | $69.04 | 0.85% | Tue 8/27/24 |
|
11
|
5 | 📈10 | $471.35 | -0.65% | $66.70 | -2.57% | Wed 8/28/24 |
|
12
|
5 | 📈11 | $470.66 | -0.79% | $66.35 | -3.08% | Thu 8/29/24 |
|
13
|
7 | 📈12 | $476.27 | 0.39% | $68.61 | 0.22% | Fri 8/30/24 |
|
14
|
4 | 📈13 | $461.81 | -2.66% | $62.35 | -8.92% | Tue 9/3/24 |
|
15
|
2 | 📈14 | $460.61 | -2.91% | $61.82 | -9.70% | Wed 9/4/24 |
|
16
|
2 | 📈15 | $461.04 | -2.82% | $62.02 | -9.41% | Thu 9/5/24 |
|
17
|
1 | 📈16 | $448.69 | -5.42% | $56.99 | -16.75% | Fri 9/6/24 |
|
18
|
1 | 📈17 | $454.46 | -4.21% | $59.11 | -13.66% | Mon 9/9/24 |
|
19
|
1 | 📈18 | $458.66 | -3.32% | $60.70 | -11.34% | Tue 9/10/24 |
|
20
|
1 | 📈19 | $468.62 | -1.22% | $64.57 | -5.68% | Wed 9/11/24 |
|
21
|
5 | 📈20 | $473.22 | -0.25% | $66.48 | -2.89% | Thu 9/12/24 |
|
22
|
5 | 📈21 | $475.34 | 0.19% | $67.35 | -1.62% | Fri 9/13/24 |
|
23
|
1 | 📈22 | $473.24 | -0.25% | $66.45 | -2.94% | Mon 9/16/24 |
|
24
|
1 | 📈23 | $473.49 | -0.20% | $66.49 | -2.88% | Tue 9/17/24 |
|
25
|
3 | 📈24 | $471.44 | -0.63% | $65.62 | -4.15% | Wed 9/18/24 |
|
26
|
3 | 📈25 | $483.36 | 1.88% | $70.58 | 3.10% | Thu 9/19/24 |
|
27
|
7 | 📈26 | $482.44 | 1.69% | $70.13 | 2.44% | Fri 9/20/24 |
|
28
|
7 | 📈27 | $483.04 | 1.82% | $70.65 | 3.20% | Mon 9/23/24 |
|
29
|
7 | 📈28 | $485.37 | 2.31% | $71.65 | 4.66% | Tue 9/24/24 |
|
30
|
7 | 📈29 | $485.95 | 2.43% | $71.67 | 4.69% | Wed 9/25/24 |
|
31
|
7 | 📈30 | $489.47 | 3.17% | $73.19 | 6.91% | Thu 9/26/24 |
|
32
|
7 | 📈31 | $486.75 | 2.60% | $71.93 | 5.07% | Fri 9/27/24 |
|
33
|
7 | 📈32 | $488.07 | 2.88% | $72.49 | 5.89% | Mon 9/30/24 |
|
34
|
6 | 📈33 | $481.27 | 1.44% | $69.42 | 1.40% | Tue 10/1/24 |
|
35
|
6 | 📈34 | $481.95 | 1.59% | $69.68 | 1.78% | Wed 10/2/24 |
|
36
|
6 | 📈35 | $481.59 | 1.51% | $69.52 | 1.55% | Thu 10/3/24 |
|
37
|
7 | 📈36 | $487.32 | 2.72% | $71.97 | 5.13% | Fri 10/4/24 |
|
38
|
6 | 📈37 | $482.10 | 1.62% | $69.60 | 1.67% | Mon 10/7/24 |
|
39
|
7 | 📈38 | $489.30 | 3.14% | $72.62 | 6.08% | Tue 10/8/24 |
|
40
|
8 | 📈39 | $493.15 | 3.95% | $74.37 | 8.63% | Wed 10/9/24 |
|
41
|
8 | 📈40 | $492.59 | 3.83% | $74.11 | 8.25% | Thu 10/10/24 |
|
42
|
8 | 📈41 | $493.36 | 3.99% | $74.30 | 8.53% | Fri 10/11/24 |
|
43
|
8 | 📈42 | $497.50 | 4.86% | $76.20 | 11.31% | Mon 10/14/24 |
|
44
|
7 | 📈43 | $490.85 | 3.46% | $73.16 | 6.87% | Tue 10/15/24 |
|
45
|
8 | 📈44 | $490.91 | 3.48% | $73.12 | 6.81% | Wed 10/16/24 |
|
46
|
8 | 📈45 | $491.25 | 3.55% | $73.34 | 7.13% | Thu 10/17/24 |
|
47
|
7 | 📈46 | $494.47 | 4.23% | $74.64 | 9.03% | Fri 10/18/24 |
|
48
|
7 | 📈47 | $495.42 | 4.43% | $75.05 | 9.63% | Mon 10/21/24 |
|
49
|
7 | 📈48 | $495.96 | 4.54% | $75.27 | 9.95% | Tue 10/22/24 |
|
50
|
6 | 📈49 | $488.36 | 2.94% | $71.79 | 4.86% | Wed 10/23/24 |
|
51
|
6 | 📈50 | $492.32 | 3.77% | $71.79 | 4.86% | Thu 10/24/24 |
|
52
|
7 | 📈51 | $495.32 | 4.41% | $74.74 | 9.17% | Fri 10/25/24 |
|
53
|
7 | 📈52 | $495.40 | 4.42% | $74.81 | 9.28% | Mon 10/28/24 |
|
54
|
7 | 📈53 | $500.16 | 5.43% | $76.88 | 12.30% | Tue 10/29/24 |
|
55
|
7 | 📈54 | $496.47 | 4.65% | $75.14 | 9.76% | Wed 10/30/24 |
|
56
|
5 | 📈55 | $483.85 | 1.99% | $69.45 | 1.45% | Thu 10/31/24 |
|
57
|
3 | 📈56 | $487.43 | 2.74% | $70.97 | 3.67% | Fri 11/1/24 |
|
58
|
5 | 📈57 | $486.01 | 2.44% | $70.27 | 2.64% | Mon 11/4/24 |
|
59
|
7 | 📈58 | $492.21 | 3.75% | $72.94 | 6.54% | Tue 11/5/24 |
|
60
|
8 | 📈59 | $505.58 | 6.57% | $78.86 | 15.19% | Wed 11/6/24 |
|
61
|
8 | 📈60 | $513.54 | 8.25% | $82.55 | 20.58% | Thu 11/7/24 |
|
62
|
7 | 📈61 | $514.14 | 8.37% | $82.75 | 20.87% | Fri 11/8/24 |
|
63
|
8 | 📈62 | $513.84 | 8.31% | $82.60 | 20.65% | Mon 11/11/24 |
|
64
|
8 | 📈63 | $512.91 | 8.11% | $82.15 | 20.00% | Tue 11/12/24 |
|
65
|
8 | 📈64 | $512.25 | 7.97% | $81.79 | 19.47% | Wed 11/13/24 |
|
66
|
8 | 📈65 | $508.69 | 7.09% | $80.06 | 16.64% | Thu 11/14/24 |
|
67
|
5 | 📈66 | $496.57 | 4.67% | $74.27 | 8.49% | Fri 11/15/24 |
|
68
|
6 | 📈67 | $500.02 | 5.40% | $75.77 | 10.68% | Mon 11/18/24 |
|
69
|
6 | 📈68 | $503.46 | 6.12% | $77.29 | 12.90% | Tue 11/19/24 |
|
70
|
7 | 📈69 | $503.17 | 6.06% | $77.20 | 12.77% | Wed 11/20/24 |
|
71
|
7 | 📈70 | $504.98 | 6.44% | $77.96 | 13.88% | Thu 11/21/24 |
|
72
|
7 | 📈71 | $505.79 | 6.61% | $78.25 | 14.30% | Fri 11/22/24 |
|
73
|
8 | 📈72 | $506.59 | 6.78% | $78.61 | 14.83% | Mon 11/25/24 |
|
74
|
8 | 📈73 | $509.31 | 7.35% | $79.83 | 16.61% | Tue 11/26/24 |
|
75
|
7 | 📈74 | $505.30 | 6.51% | $77.90 | 13.79% | Wed 11/27/24 |
|
76
|
7 | 📈75 | $509.74 | 7.44% | $79.89 | 16.70% | Fri 11/29/24 |
|
77
|
8 | 📈76 | $515.29 | 8.61% | $82.48 | 20.48% | Mon 12/2/24 |
|
78
|
7 | 📈77 | $516.87 | 8.95% | $83.21 | 21.55% | Tue 12/3/24 |
|
79
|
8 | 📈78 | $523.26 | 10.29% | $86.25 | 25.99% | Wed 12/4/24 |
|
80
|
8 | 📈79 | $521.81 | 9.99% | $85.54 | 24.95% | Thu 12/5/24 |
|
81
|
8 | 📈80 | $526.48 | 10.97% | $87.74 | 28.16% | Fri 12/6/24 |
|
82
|
7 | 📈81 | $522.38 | 10.11% | $85.69 | 25.17% | Mon 12/9/24 |
|
83
|
7 | 📈82 | $520.60 | 9.73% | $84.76 | 23.81% | Tue 12/10/24 |
|
84
|
8 | 📈83 | $529.92 | 11.70% | $89.29 | 30.43% | Wed 12/11/24 |
|
85
|
7 | 📈84 | $526.50 | 10.98% | $87.52 | 27.84% | Thu 12/12/24 |
|
86
|
7 | 📈85 | $530.53 | 11.83% | $89.40 | 30.59% | Fri 12/13/24 |
|
87
|
7 | 📈86 | $538.17 | 13.44% | $93.29 | 36.27% | Mon 12/16/24 |
|
88
|
7 | 📈87 | $535.80 | 12.94% | $92.04 | 34.44% | Tue 12/17/24 |
|
89
|
3 | 📈88 | $516.47 | 8.86% | $82.09 | 19.91% | Wed 12/18/24 |
|
90
|
3 | 📈89 | $514.17 | 8.38% | $80.93 | 18.22% | Thu 12/19/24 |
|
91
|
4 | 📈90 | $518.66 | 9.33% | $83.03 | 21.28% | Fri 12/20/24 |
|
92
|
4 | 📈91 | $522.87 | 10.21% | $85.06 | 24.25% | Mon 12/23/24 |
|
93
|
5 | 📈92 | $529.96 | 11.71% | $88.44 | 29.18% | Tue 12/24/24 |
|
94
|
5 | 📈93 | $529.60 | 11.63% | $88.25 | 28.91% | Thu 12/26/24 |
|
95
|
4 | 📈94 | $522.56 | 10.15% | $84.66 | 23.66% | Fri 12/27/24 |
|
96
|
3 | 📈95 | $515.61 | 8.68% | $81.26 | 18.70% | Mon 12/30/24 |
|
97
|
2 | 📈96 | $511.23 | 7.76% | $79.13 | 15.59% | Tue 12/31/24 |
|
98
|
2 | 📈97 | $510.23 | 7.55% | $78.63 | 14.86% | Thu 1/2/25 |
|
99
|
3 | 📈98 | $518.58 | 9.31% | $82.40 | 20.36% | Fri 1/3/25 |
|
100
|
5 | 📈99 | $524.54 | 10.56% | $85.21 | 24.47% | Mon 1/6/25 |
|
101
|
2 | 📈100 | $515.18 | 8.59% | $80.62 | 17.76% | Tue 1/7/25 |
|
102
|
-2 | 📉1 | $515.27 | 8.61% | $80.68 | 17.85% | Wed 1/8/25 |

Market Signal data and cumulative return since the start of the current trend is published on the Current Trend page.
Did you know?
Market Signal data and cumulative return since the start of the current trend is published on the Current Trend page.
QQQ Benchmark
TQQQ outperformed QQQ by +9.24% over the uptrend. Their returns were +17.85% and +8.61% respectively.
As a ratio however, TQQQ's return was more than 2x QQQ's. For example, a $10,000 investment in TQQQ and QQQ over this timeframe would have returned $1785 and $861 respectively.
Risk Management
Buying and holding TQQQ over the uptrend returned +17.85%. This return is not unsatisfactory, and even outperformed QQQ, but it also leaves some money on the table.
When trading 3x leveraged ETFs, actively managing positions is crucial to maximizing returns and minimizing risk. This section examines how Raincheck Fund's risk management approach earned a higher return than simply buying-and-holding TQQQ during the uptrend (Thurs. Aug. 15th 2024 – Wed. Jan. 8th 2025).
TQQQ ▲25.10%
Opening the position:
- Fri. Aug. 16th 2024 - Uptrend is established (2nd consecutive day of positive Market Signal). Deploy 50% of capital;
$68.64at close. - Tues. Sep. 10th 2024 - Uptrend persists (Market Signal remains positive), but price has declined since day 📈1. Deploy additional 30% of capital to lower cost basis;
$60.70at close.
Using closing prices, average cost is $65.66.
Closing the position:
As a way to lock in profit and reduce risk, profit is taken incrementally at +10%, +20%, and +30% levels.
The remainder of the position is held until the uptrend ends.
- Reference the trend table above to see that
TQQQ's cumulative return crossed the +10%, +20%, and +30% levels on Mon. Oct. 14th 2024, Thurs. Nov. 7th 2024, and Wed. Dec. 11th 2024 respectively. - This position's cost basis (
$65.66) is lowerTQQQ's day 📈1 closing price ($68.46), so its return on these days will be higher than the values in the trend table'sTQQQ % chgcolumn.
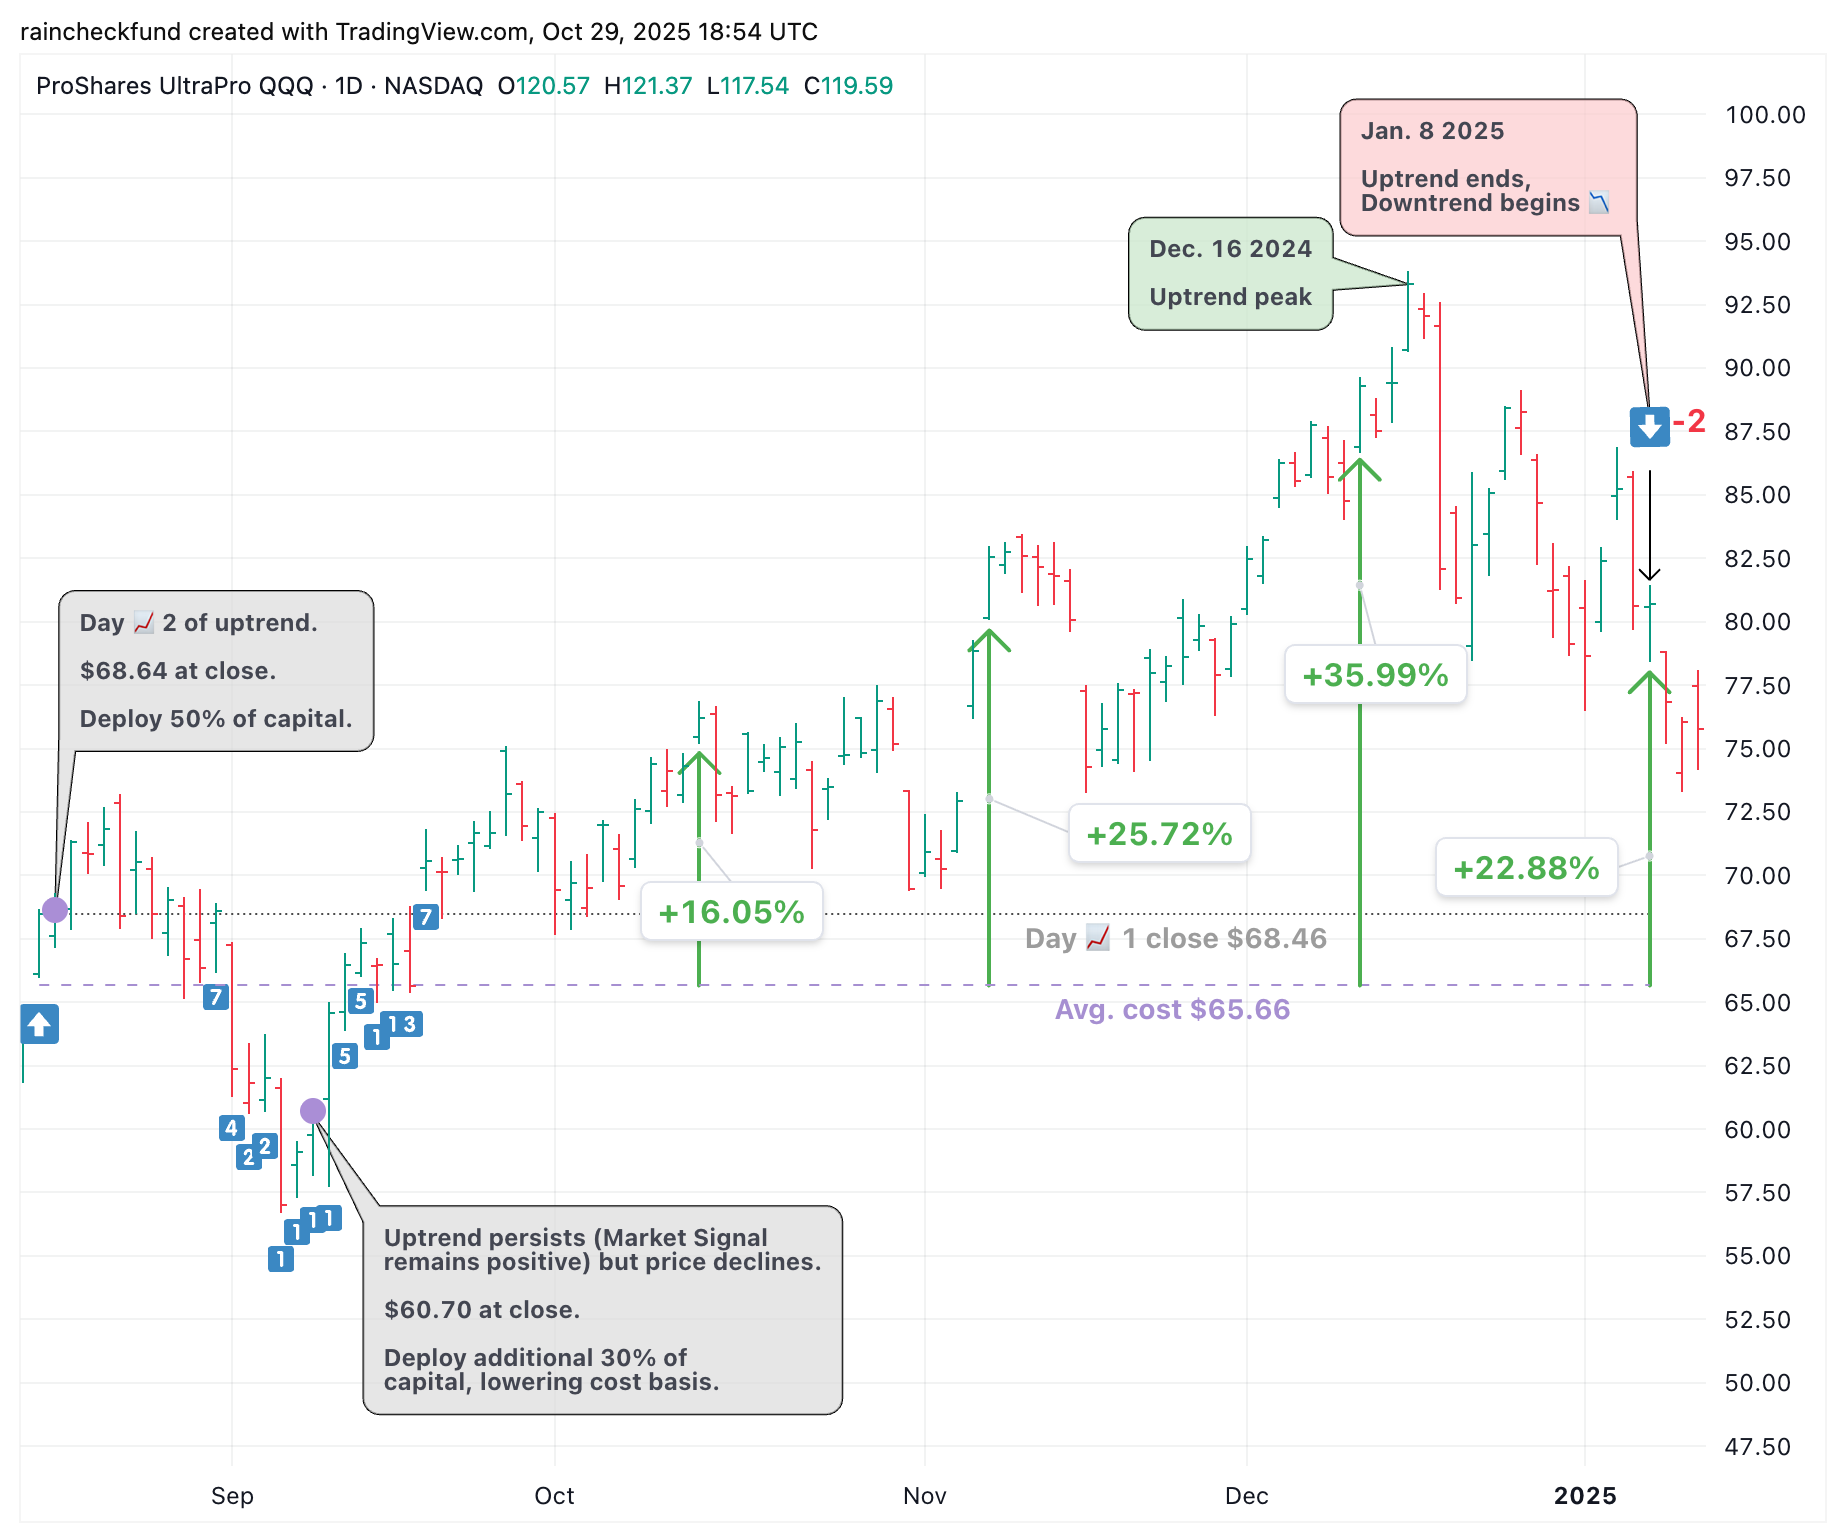
The overall return on this TQQQ position is +25.10%
- Mon. Oct. 14th 2024 - Take Profit. Sell 10% of position for
$76.20(+16.05%) - Thurs. Nov. 7th 2024 - Take Profit. Sell 10% of position for
$82.55(+25.72%) - Wed. Dec. 11th 2024 - Take Profit. Sell 20% for
$89.29(+35.99%) - Wed. Jan. 8th 2025 - Uptrend ends. Sell remaining 60% for
$80.68(+22.88%)
(0.10×0.1605)+(0.10×0.2572)+(0.20×0.3599)+(0.60×0.2288) = 0.2510
TBIL ▲1.73%
Remember, 80% of the portfolio's capital was allocated to TQQQ. Per Raincheck Fund's approach, the remaining 20% of capital was in TBIL as a hedge.
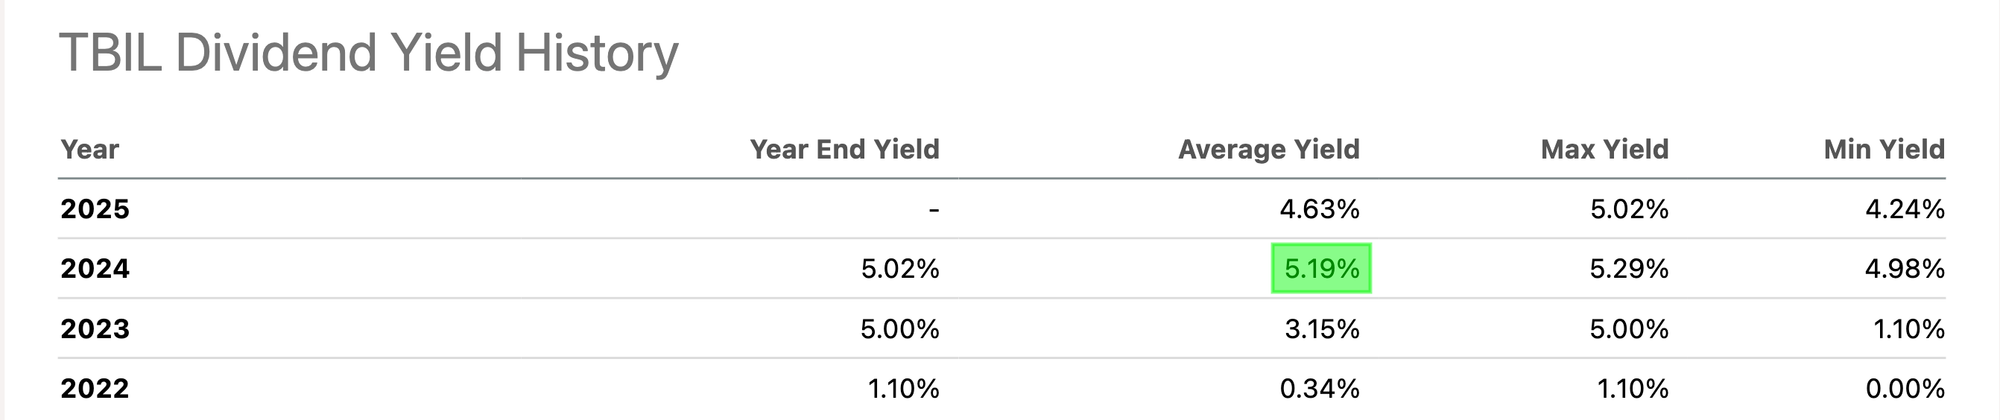
TBIL ETF delivers a low-risk yield by investing in short-term U.S. Treasury bills, with monthly dividends reflecting current Treasury rates.This position would have received 4 dividends, as TBIL pays dividends monthly, and the uptrend spanned 4+ months (Thurs. Aug. 15th 2024 – Wed. Jan. 8th 2025). Given TBIL's average yield was +5.19% in 2024, this position's return is approximately +1.73%.
0.0519×(4/12) = 0.0173
Total Return ▲20.43%
A +25.10% return on TQQQ and +1.73% return on TBIL brings the portfolio's total return to +20.43%
(0.80×0.2510)+(0.20×0.0173) = 0.2043
QQQ's buy-and-hold return.A $10,000 actively managed
TQQQ position returned $2043, while buy-and-hold QQQ returned $861. Actively managing capital allocation and proactively taking profits earned an outsized return compared to buy-and-hold.
This +20.43% return exceeds TQQQ's buy-and-hold return of +17.85% by almost +3%, and QQQ's buy-and-hold return by almost +12%.
QQQbuy-and-hold → +8.61%TQQQbuy-and-hold → +17.85%TQQQactively managed → +20.43%
TQQQ vs QQQ holdings
TQQQ outperformed 71% of NASDAQ-100 (QQQ) holdings, including all of the Magnificent 7 except for TSLA, AMZN, and GOOG/GOOGL.
In other words, there is less than 3 in 10 chance of having selected NASDAQ-100 stocks that outperformed TQQQ during of the uptrend.
| A | B | C | D | E | |
|---|---|---|---|---|---|
|
1
|
Market Cap | Symbol | %Chg since 📈1 | Close on 📈1 | Close |
|
2
|
188,115 M | QQQ | 8.61% | $474.42 | $515.27 |
|
3
|
117,675 M | APP | 284.67% | $85.58 | $329.20 |
|
4
|
83,373 M | MSTR | 151.42% | $131.93 | $331.70 |
|
5
|
181,991 M | PLTR | 118.55% | $31.22 | $68.23 |
|
6
|
1,317,537 M | TSLA | 84.43% | $214.14 | $394.94 |
|
7
|
102,261 M | MRVL | 70.53% | $69.33 | $118.23 |
|
8
|
65,179 M | TEAM | 66.51% | $146.83 | $244.49 |
|
9
|
45,834 M | AXON | 54.50% | $373.69 | $577.34 |
|
10
|
46,056 M | LULU | 53.16% | $256.55 | $392.92 |
|
11
|
25,930 M | WBD | 38.95% | $7.24 | $10.06 |
|
12
|
1,090,045 M | AVGO | 38.03% | $166.13 | $229.31 |
|
13
|
88,431 M | CRWD | 37.71% | $260.49 | $358.72 |
|
14
|
162,301 M | BKNG | 34.05% | $3,634.67 | $4,872.42 |
|
15
|
72,678 M | DASH | 33.33% | $130.29 | $173.72 |
|
16
|
376,612 M | NFLX | 31.93% | $663.22 | $875.00 |
|
17
|
74,706 M | FTNT | 30.84% | $73.40 | $96.04 |
|
18
|
87,822 M | PYPL | 29.44% | $67.94 | $87.94 |
|
19
|
78,942 M | CEG | 28.07% | $190.39 | $243.84 |
|
20
|
33,150 M | TTWO | 25.52% | $146.38 | $183.74 |
|
21
|
2,357,360 M | AMZN | 25.08% | $177.59 | $222.13 |
|
22
|
42,213 M | BKR | 23.83% | $35.08 | $43.44 |
|
23
|
76,499 M | MAR | 23.27% | $221.90 | $273.53 |
|
24
|
234,425 M | CSCO | 21.99% | $48.53 | $59.20 |
|
25
|
49,202 M | DDOG | 21.96% | $116.33 | $141.88 |
|
26
|
60,137 M | TTD | 20.92% | $100.50 | $121.52 |
|
27
|
2,347,701 M | GOOGL | 20.24% | $161.30 | $193.95 |
|
28
|
113,921 M | GILD | 19.91% | $74.34 | $89.14 |
|
29
|
2,364,104 M | GOOG | 19.75% | $163.17 | $195.39 |
|
30
|
63,372 M | ADSK | 18.45% | $250.21 | $296.37 |
|
31
|
54,999 M | PCAR | 17.92% | $92.01 | $108.50 |
|
32
|
42,016 M | TQQQ | 17.85% | $68.46 | $80.68 |
|
33
|
3,538,070 M | NVDA | 14.04% | $122.86 | $140.11 |
|
34
|
1,526,382 M | META | 13.66% | $537.33 | $610.72 |
|
35
|
190,661 M | ISRG | 13.30% | $480.17 | $544.02 |
|
36
|
38,296 M | XEL | 12.72% | $58.90 | $66.39 |
|
37
|
50,290 M | PAYX | 11.47% | $125.82 | $140.25 |
|
38
|
148,275 M | ARM | 11.32% | $130.44 | $145.20 |
|
39
|
147,294 M | HON | 10.94% | $198.46 | $220.17 |
|
40
|
254,274 M | TMUS | 10.73% | $194.63 | $215.52 |
|
41
|
118,851 M | ADP | 10.71% | $263.66 | $291.89 |
|
42
|
31,666 M | DXCM | 10.68% | $72.36 | $80.09 |
|
43
|
54,834 M | CPRT | 10.04% | $51.60 | $56.78 |
|
44
|
84,788 M | ABNB | 10.03% | $118.88 | $130.80 |
|
45
|
67,255 M | WDAY | 9.99% | $231.56 | $254.69 |
|
46
|
50,950 M | MNST | 9.81% | $46.99 | $51.60 |
|
47
|
41,070 M | FAST | 9.47% | $66.63 | $72.94 |
|
48
|
83,338 M | CDNS | 8.07% | $280.12 | $302.73 |
|
49
|
69,520 M | ORLY | 8.05% | $1,115.89 | $1,205.74 |
|
50
|
3,678,587 M | AAPL | 8.00% | $224.72 | $242.70 |
|
51
|
406,869 M | COST | 5.70% | $877.35 | $927.37 |
|
52
|
29,591 M | ANSS | 5.68% | $325.00 | $343.47 |
|
53
|
39,014 M | VRSK | 5.37% | $266.14 | $280.42 |
|
54
|
50,892 M | ROST | 4.62% | $147.80 | $154.63 |
|
55
|
38,234 M | EXC | 1.84% | $37.50 | $38.19 |
|
56
|
36,787 M | GEHC | 1.13% | $85.30 | $86.26 |
|
57
|
3,147,557 M | MSFT | 0.84% | $421.03 | $424.56 |
|
58
|
37,871 M | CTSH | 0.73% | $75.47 | $76.02 |
|
59
|
120,249 M | PANW | 0.69% | $171.64 | $172.83 |
|
60
|
74,990 M | CTAS | 0.37% | $191.94 | $192.65 |
|
61
|
19,744 M | MDB | -0.15% | $249.05 | $248.68 |
|
62
|
50,952 M | CHTR | -0.76% | $352.01 | $349.32 |
|
63
|
35,101 M | CCEP | -1.13% | $76.78 | $75.91 |
|
64
|
106,887 M | ADI | -1.44% | $223.67 | $220.44 |
|
65
|
28,515 M | ZS | -1.61% | $190.34 | $187.28 |
|
66
|
38,368 M | EA | -1.93% | $147.04 | $144.20 |
|
67
|
104,967 M | SBUX | -2.40% | $94.88 | $92.60 |
|
68
|
88,675 M | INTC | -3.91% | $20.69 | $19.88 |
|
69
|
176,412 M | INTU | -4.00% | $652.14 | $626.05 |
|
70
|
62,365 M | CSX | -4.25% | $33.63 | $32.20 |
|
71
|
29,620 M | CSGP | -4.31% | $74.55 | $71.34 |
|
72
|
49,023 M | AEP | -4.45% | $96.56 | $92.26 |
|
73
|
173,786 M | TXN | -5.09% | $201.93 | $191.66 |
|
74
|
144,146 M | CMCSA | -5.95% | $39.52 | $37.17 |
|
75
|
55,184 M | ROP | -6.64% | $546.57 | $510.30 |
|
76
|
100,131 M | MU | -7.05% | $106.95 | $99.41 |
|
77
|
196,891 M | LIN | -7.92% | $456.14 | $420.01 |
|
78
|
175,349 M | QCOM | -8.23% | $173.34 | $159.08 |
|
79
|
23,864 M | GFS | -8.39% | $45.43 | $41.62 |
|
80
|
76,317 M | SNPS | -8.44% | $548.28 | $502.00 |
|
81
|
38,624 M | ODFL | -8.91% | $197.14 | $179.58 |
|
82
|
34,026 M | IDXX | -10.95% | $485.52 | $432.36 |
|
83
|
42,783 M | KDP | -11.92% | $35.33 | $31.12 |
|
84
|
104,843 M | VRTX | -12.69% | $472.00 | $412.11 |
|
85
|
92,988 M | MELI | -12.89% | $1,996.44 | $1,739.00 |
|
86
|
49,918 M | FANG | -13.02% | $196.58 | $170.99 |
|
87
|
37,013 M | KHC | -13.25% | $34.19 | $29.66 |
|
88
|
96,643 M | LRCX | -13.45% | $89.01 | $77.04 |
|
89
|
205,318 M | PEP | -15.06% | $172.52 | $146.54 |
|
90
|
138,375 M | AMAT | -16.45% | $211.83 | $176.99 |
|
91
|
80,044 M | MDLZ | -17.06% | $70.28 | $58.29 |
|
92
|
53,083 M | NXPI | -17.19% | $253.25 | $209.72 |
|
93
|
203,451 M | AMD | -17.32% | $147.36 | $121.84 |
|
94
|
87,882 M | KLAC | -17.94% | $836.19 | $686.20 |
|
95
|
23,219 M | CDW | -18.27% | $221.87 | $181.34 |
|
96
|
140,414 M | AMGN | -18.80% | $325.39 | $264.21 |
|
97
|
280,886 M | ASML | -19.85% | $928.25 | $743.98 |
|
98
|
205,447 M | AZN | -21.58% | $84.90 | $66.58 |
|
99
|
27,213 M | ON | -23.15% | $75.88 | $58.31 |
|
100
|
189,537 M | ADBE | -24.29% | $554.16 | $419.58 |
|
101
|
22,180 M | BIIB | -25.23% | $201.63 | $150.75 |
|
102
|
30,969 M | MCHP | -30.65% | $81.30 | $56.38 |
|
103
|
134,461 M | PDD | -30.85% | $145.08 | $100.32 |
|
104
|
78,917 M | REGN | -37.58% | $1,175.33 | $733.59 |
Cumulative Return & Sharpe Ratio
Assuming 3% for the risk-free rate, the Sharpe Ratio for a TQQQ position over the uptrend (opened at close on day 📈1 of the uptrend and closed when l the uptrend ended) is 0.99.
Exit opportunities
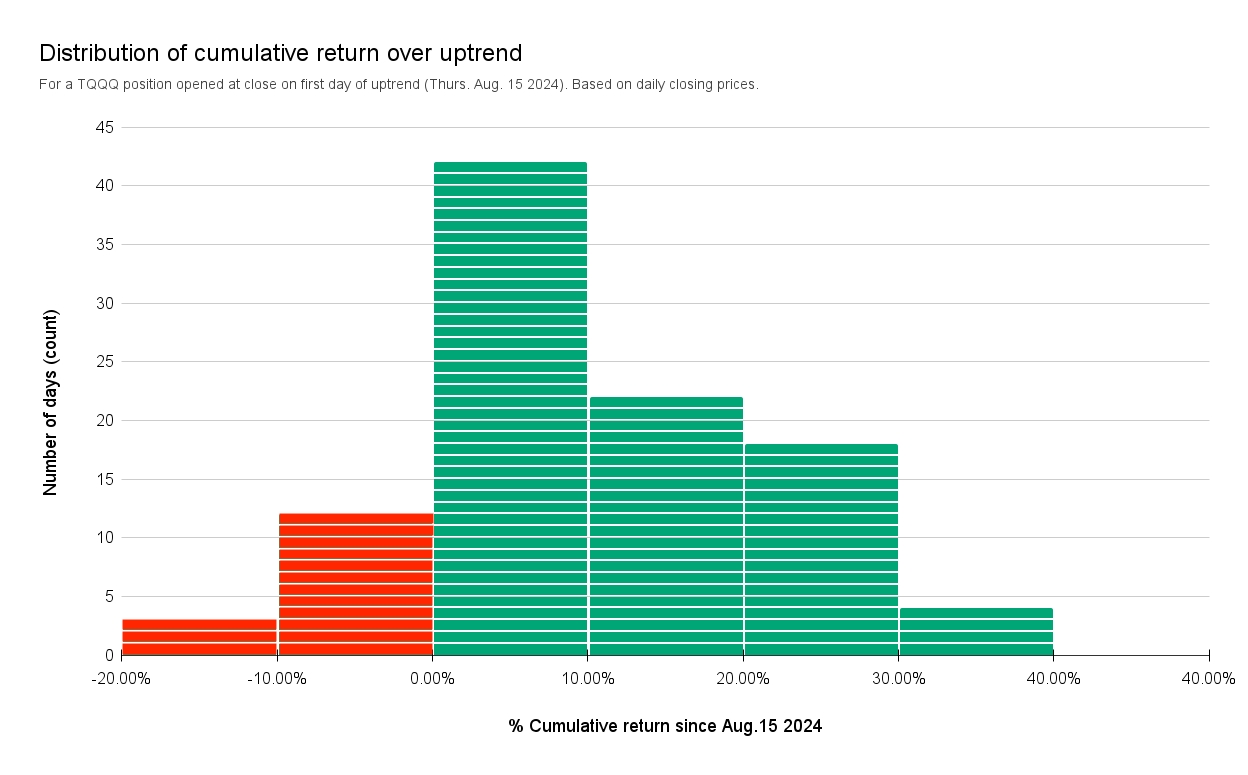
The distribution of cumulative returns for TQQQ over the uptrend shows a distinct positive skew, demonstrating that the Market Signal correctly identified a period of sustained market strength.
A TQQQ position opened at close on day 📈1 of the uptrend was in the green for 85% of the uptrend, and in the red for just 15% of the uptrend.
- Most observations (64 days, or 64% of the uptrend) fell within the 0% to +20% cumulative return range, confirming steady returns from day 📈1 of uptrend
- The right tail extending toward +40% highlights periods of accelerated performance
- 22 days (or 22% of the uptrend) offered a return between +20% and +40%
- 17 days (or 17% of the uptrend) registered negative cumulative returns, most of which were less than a –10% loss
The distribution reflects consistent positive drift and limited downside deviation.
Disclaimer: The information that Raincheck Fund provides is general in nature as it has been prepared without taking account of your objectives, financial situation or needs. It is not intended as legal, financial or investment advice and should not be construed or relied on as such. Raincheck Fund is for information purposes only. Raincheck Fund is not responsible for any damages or losses that may occur as a result of reliance on this information. Before making any commitment of a legal or financial nature you should seek advice from a qualified and registered legal practitioner or financial or investment adviser.
All content, group, messaging, tweets, newsletter, article, and email created by Raincheck Fund is intended for educational and information purposes only, is not financial, investment, legal or tax advice, and is a restatement, summary or extract of other data and research reports that are widely distributed and publicly available. Raincheck Fund is not a registered financial, investment, legal or tax advisor and is not liable for any financial loss you may incur acting on any information provided by Raincheck Fund.
Investment advice provided solely by Autopilot advisers LLC, an SEC registered investment advisor. Past performance does not guarantee future results. Investing carries risks, including the risk of the loss of principal.
Investing in securities involves significant risk, including the risk of loss of principal. Past performance does not guarantee future results, and there can be no assurance that any investment strategy or security will meet its objectives or achieve any specific financial outcome. You should only invest risk capital that you can afford to lose without impacting your financial stability. Carefully consider your individual financial situation, investment goals, and risk tolerance before making any investment decisions.