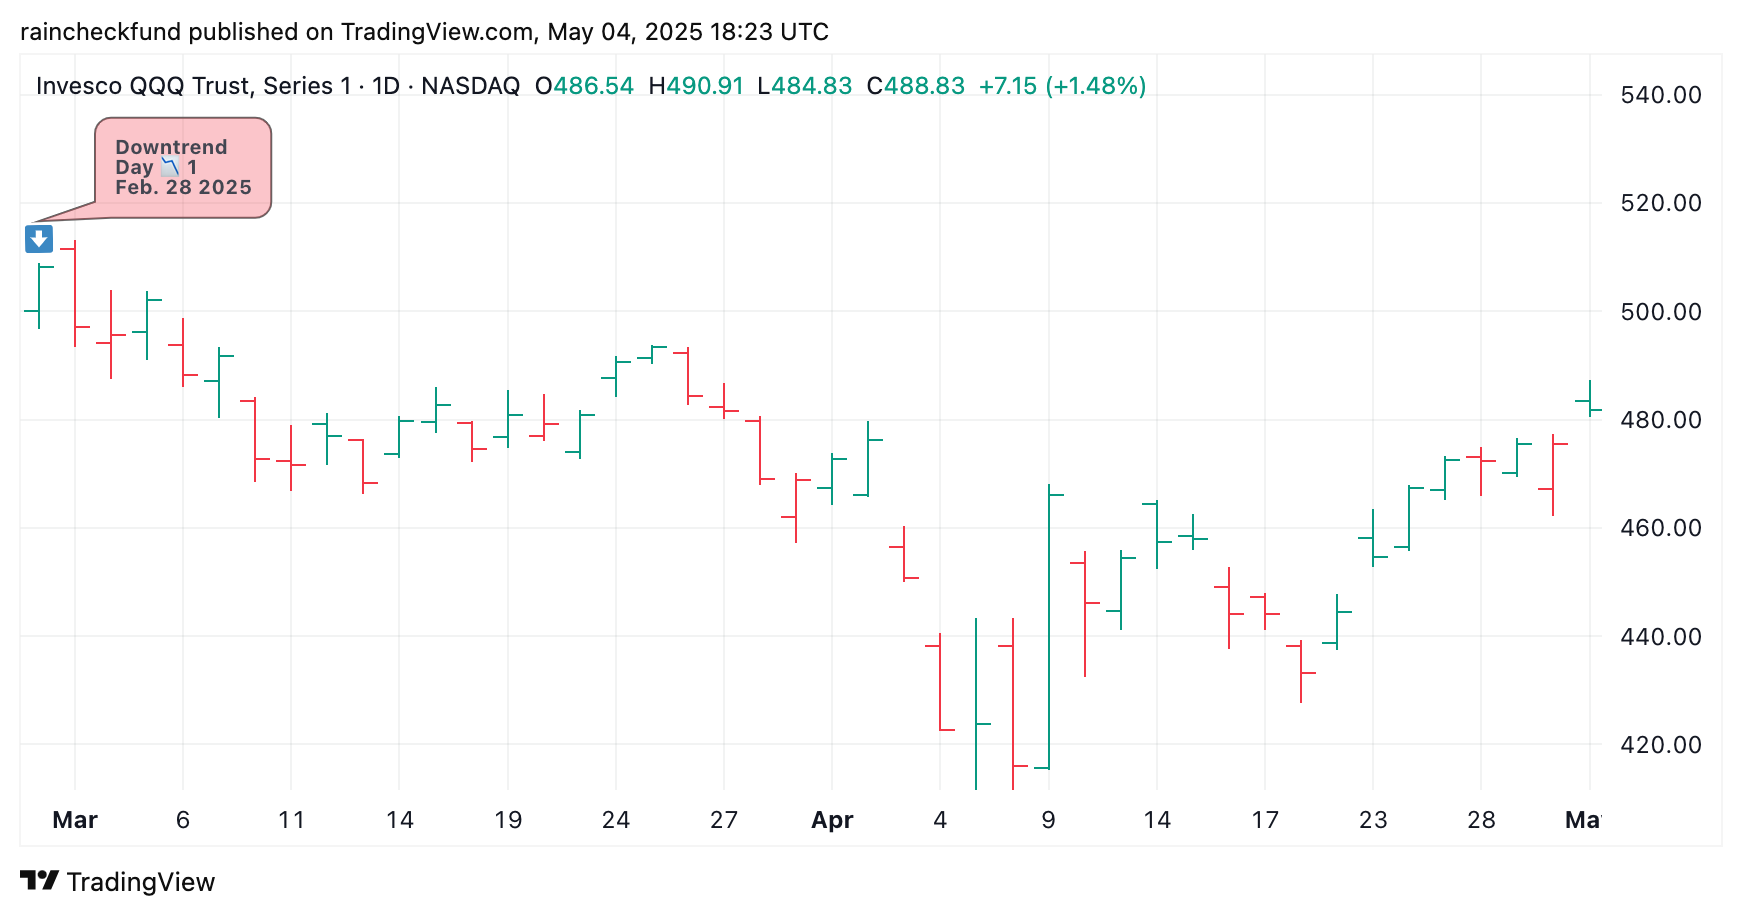
Feb. 28th 2025: 📉43 day downtrend, SQQQ +68.69% gain at peak
SQQQ during downtrends and outperform the market.At the peak of this downtrend, Raincheck Fund's strategy was outperforming
QQQ by +86.82%Returns
The downtrend began on Fri. Feb. 28 2025 and ended on Thurs. May 1 2025, after 43 consecutive days of negative Market Signal values.
The histogram below shows the exit opportunities for an SQQQ position opened on day 📉1 of the downtrend, based on closing prices for each of the 43 days comprising the downtrend.
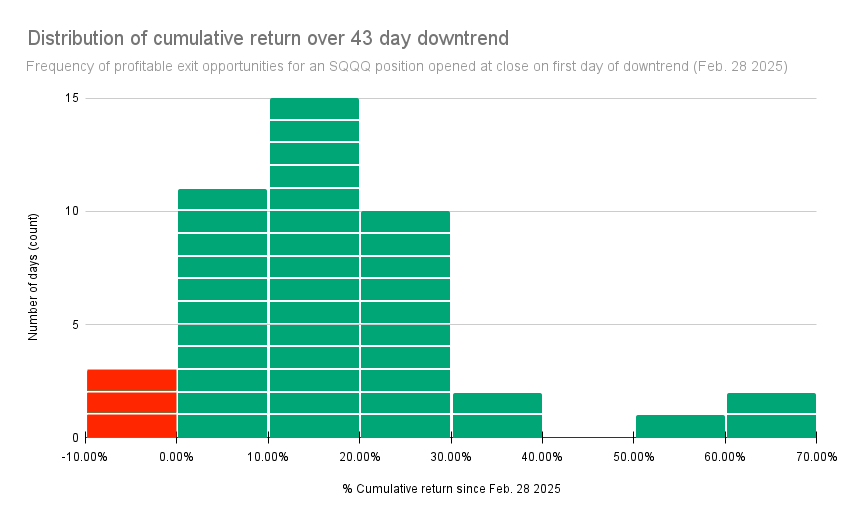
- The last 3 days of the downtrend were the only days the position was in the red, and 2 of these days were a cumulative loss of just ~1%
- During most of the downtrend, the position's return was between +10% and +20% profit
- There were 5 days when the position's return was greater than +30%, and 3 days it was greater than +50%
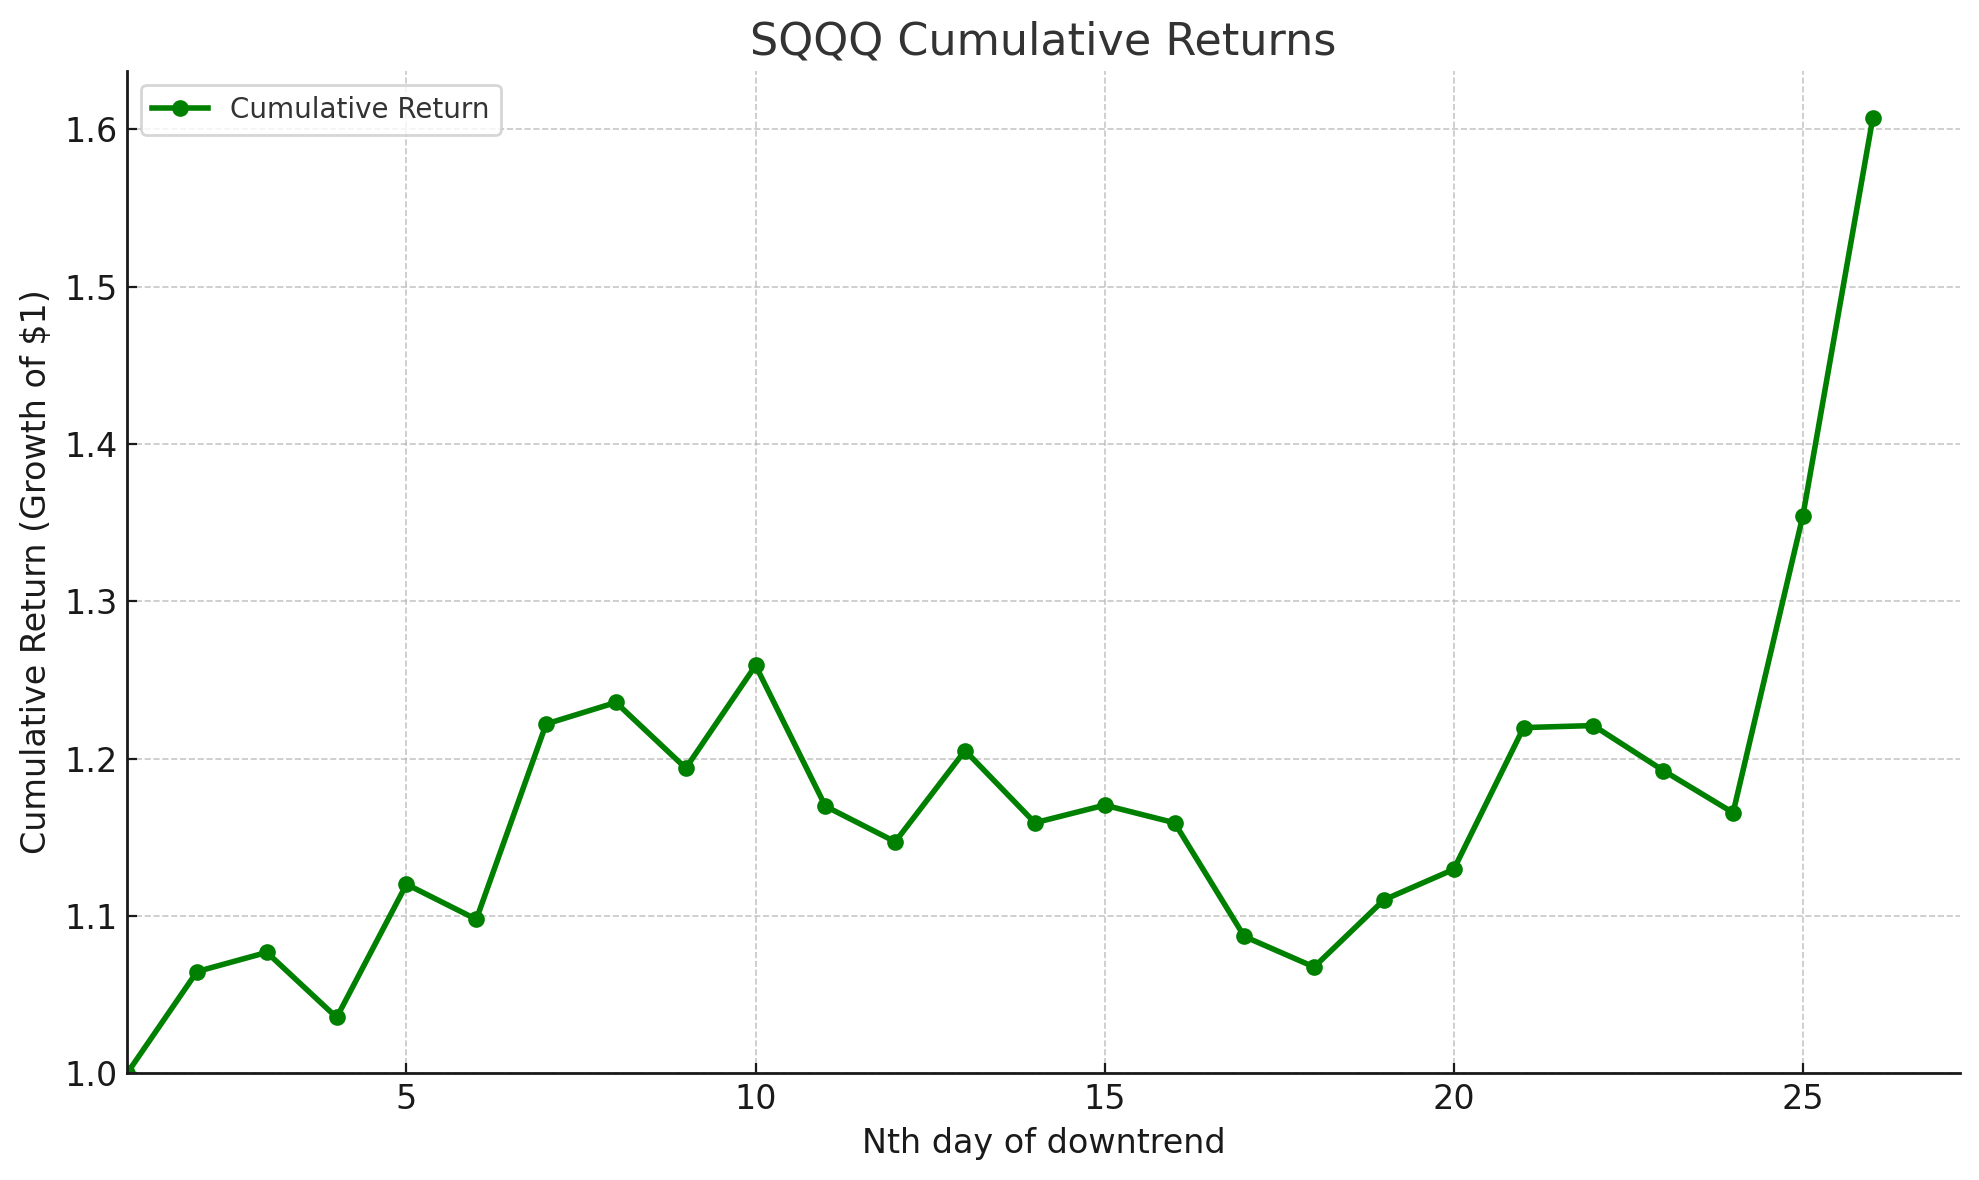
As of Fri. Apr 4 2025 (day 📉26 of downtrend), an SQQQ position would be up +60.38%. Assuming 3% for the risk-free rate, the Sharpe Ratio for this investment is 5.08.
At this point in time, SQQQ was outperforming 100% of QQQ holdings since day 📉1 of the downtrend (Feb. 28th 2025). Other than MSTR, SQQQ was outperforming all other QQQ holdings by more than 10x over the same timeframe.
The downtrend peaked 2 days later on Tues. Apr. 8th 2025. SQQQ was up +68.69% since day 📉1 of the downtrend, while QQQ was down -18.13%; an +86.82% outperformance.
The table below contains the Market Signal, Trend Count, closing prices, and cumulative return (%) over the downtrend.
| A | B | C | D | E | F | G | |
|---|---|---|---|---|---|---|---|
|
1
|
Market Signal | Trend Count | QQQ Close | QQQ %chg since 📉1 | SQQQ close | SQQQ %chg since 📉1 | Date |
|
2
|
-2 | 📉1 | $508.17 | 0.00% | $31.40 | 0.00% | Fri 2/28/25 |
|
3
|
-3 | 📉2 | $497.05 | -2.19% | $33.43 | 6.46% | Mon 3/3/25 |
|
4
|
-3 | 📉3 | $495.55 | -2.48% | $33.81 | 7.68% | Tue 3/4/25 |
|
5
|
-3 | 📉4 | $502.01 | -1.21% | $32.51 | 3.54% | Wed 3/5/25 |
|
6
|
-3 | 📉5 | $488.20 | -3.93% | $35.17 | 12.01% | Thu 3/6/25 |
|
7
|
-3 | 📉6 | $491.79 | -3.22% | $34.47 | 9.78% | Fri 3/7/25 |
|
8
|
-3 | 📉7 | $472.73 | -6.97% | $38.37 | 22.20% | Mon 3/10/25 |
|
9
|
-3 | 📉8 | $471.60 | -7.20% | $38.80 | 23.57% | Tue 3/11/25 |
|
10
|
-3 | 📉9 | $476.92 | -6.15% | $37.49 | 19.39% | Wed 3/12/25 |
|
11
|
-3 | 📉10 | $468.34 | -7.84% | $39.54 | 25.92% | Thu 3/13/25 |
|
12
|
-3 | 📉11 | $479.66 | -5.61% | $36.73 | 16.97% | Fri 3/14/25 |
|
13
|
-3 | 📉12 | $482.77 | -5.00% | $36.02 | 14.71% | Mon 3/17/25 |
|
14
|
-3 | 📉13 | $474.54 | -6.62% | $37.84 | 20.51% | Tue 3/18/25 |
|
15
|
-2 | 📉14 | $480.89 | -5.37% | $36.40 | 15.92% | Wed 3/19/25 |
|
16
|
-2 | 📉15 | $479.26 | -5.69% | $36.75 | 17.04% | Thu 3/20/25 |
|
17
|
-2 | 📉16 | $480.84 | -5.38% | $36.40 | 15.92% | Fri 3/21/25 |
|
18
|
-2 | 📉17 | $490.66 | -3.45% | $34.13 | 8.69% | Mon 3/24/25 |
|
19
|
-2 | 📉18 | $493.46 | -2.89% | $33.52 | 6.75% | Tue 3/25/25 |
|
20
|
-2 | 📉19 | $484.38 | -4.68% | $34.86 | 11.02% | Wed 3/26/25 |
|
21
|
-3 | 📉20 | $481.62 | -5.22% | $35.47 | 12.96% | Thu 3/27/25 |
|
22
|
-3 | 📉21 | $468.94 | -7.72% | $38.30 | 21.97% | Fri 3/28/25 |
|
23
|
-7 | 📉22 | $468.92 | -7.72% | $38.34 | 22.10% | Mon 3/31/25 |
|
24
|
-7 | 📉23 | $472.70 | -6.98% | $37.44 | 19.24% | Tue 4/1/25 |
|
25
|
-7 | 📉24 | $476.15 | -6.30% | $36.60 | 16.56% | Wed 4/2/25 |
|
26
|
-8 | 📉25 | $450.66 | -11.32% | $42.53 | 35.45% | Thu 4/3/25 |
|
27
|
-8 | 📉26 | $422.67 | -16.83% | $50.36 | 60.38% | Fri 4/4/25 |
|
28
|
-8 | 📉27 | $423.69 | -16.62% | $50.17 | 59.78% | Mon 4/7/25 |
|
29
|
-8 | 📉28 | $416.06 | -18.13% | $52.97 | 68.69% | Tue 4/8/25 |
|
30
|
-6 | 📉29 | $466.00 | -8.30% | $34.28 | 9.17% | Wed 4/9/25 |
|
31
|
-7 | 📉30 | $446.18 | -12.20% | $38.21 | 21.69% | Thu 4/10/25 |
|
32
|
-6 | 📉31 | $454.40 | -10.58% | $36.22 | 15.35% | Fri 4/11/25 |
|
33
|
-6 | 📉32 | $457.48 | -9.98% | $35.45 | 12.90% | Mon 4/14/25 |
|
34
|
-6 | 📉33 | $457.99 | -9.87% | $35.34 | 12.55% | Tue 4/15/25 |
|
35
|
-6 | 📉34 | $444.18 | -12.59% | $38.54 | 22.74% | Wed 4/16/25 |
|
36
|
-7 | 📉35 | $444.10 | -12.61% | $38.64 | 23.06% | Thu 4/17/25 |
|
37
|
-8 | 📉36 | $433.11 | -14.77% | $41.49 | 32.13% | Mon 4/21/25 |
|
38
|
-7 | 📉37 | $444.48 | -12.53% | $38.28 | 21.91% | Tue 4/22/25 |
|
39
|
-6 | 📉38 | $454.56 | -10.55% | $35.76 | 13.89% | Wed 4/23/25 |
|
40
|
-5 | 📉39 | $467.35 | -8.03% | $32.72 | 4.20% | Thu 4/24/25 |
|
41
|
-5 | 📉40 | $472.56 | -7.01% | $31.65 | 0.80% | Fri 4/25/25 |
|
42
|
-4 | 📉41 | $472.41 | -7.04% | $31.69 | 0.92% | Mon 4/28/25 |
|
43
|
-4 | 📉42 | $475.53 | -6.42% | $31.08 | -1.02% | Tue 4/29/25 |
|
44
|
-4 | 📉43 | $475.47 | -6.43% | $31.06 | -1.08% | Wed 4/30/25 |
|
45
|
2 | 📈1 | $481.68 | -5.21% | $30.01 | -4.43% | Thu 5/1/25 |
SQQQ vs QQQ Holdings
For a majority of the downtrend, it would have been nearly impossible to pick QQQ holdings that outperformed SQQQ.
As of close at the end of each week, SQQQ was outperforming 99% or more of QQQ holdings, until the last two weeks of the downtrend.
SQQQ outperformed 79% of QQQ holdings the second to last week of the downtrend, and 57% of QQQ holdings the last week of the downtrend (see table below)
Note that just buying and holding QQQ over the downtrend would have fared worse than buying and holdingSQQQ.
| A | B | C | D | E | |
|---|---|---|---|---|---|
|
1
|
Market Cap | Symbol | %Chg since 📉1 | Close on 📉1 | Close |
|
2
|
177,323 M | QQQ | -5.21% | $508.17 | $481.68 |
|
3
|
107,821 M | MSTR | 49.40% | $255.43 | $381.60 |
|
4
|
293,262 M | PLTR | 36.83% | $84.92 | $116.20 |
|
5
|
84,530 M | CDNS | 19.65% | $250.50 | $299.73 |
|
6
|
48,901 M | AXON | 17.53% | $528.45 | $621.10 |
|
7
|
35,659 M | ZS | 15.71% | $196.23 | $227.06 |
|
8
|
492,169 M | NFLX | 15.59% | $980.56 | $1,133.47 |
|
9
|
39,379 M | EA | 12.38% | $129.12 | $145.10 |
|
10
|
38,741 M | TTWO | 10.94% | $211.98 | $235.17 |
|
11
|
109,208 M | CRWD | 10.84% | $389.66 | $431.88 |
|
12
|
59,144 M | CPRT | 10.40% | $54.80 | $60.50 |
|
13
|
58,438 M | MNST | 8.91% | $54.65 | $59.52 |
|
14
|
115,625 M | MELI | 8.14% | $2,121.87 | $2,294.52 |
|
15
|
37,951 M | IDXX | 7.84% | $437.11 | $471.38 |
|
16
|
3,235,238 M | MSFT | 7.16% | $396.99 | $425.40 |
|
17
|
47,106 M | FAST | 6.58% | $75.73 | $80.71 |
|
18
|
87,724 M | MDLZ | 5.67% | $64.23 | $67.87 |
|
19
|
46,923 M | EXC | 5.43% | $44.20 | $46.60 |
|
20
|
54,040 M | CHTR | 5.34% | $363.57 | $383.00 |
|
21
|
128,836 M | VRTX | 3.97% | $479.79 | $498.86 |
|
22
|
41,181 M | CCEP | 3.80% | $86.26 | $89.54 |
|
23
|
80,182 M | ORLY | 2.48% | $1,373.64 | $1,407.68 |
|
24
|
169,301 M | BKNG | 1.70% | $5,016.01 | $5,101.43 |
|
25
|
46,735 M | KDP | 1.55% | $33.52 | $34.04 |
|
26
|
176,594 M | INTU | 1.52% | $613.84 | $623.19 |
|
27
|
57,505 M | AEP | 1.40% | $106.05 | $107.54 |
|
28
|
85,421 M | CTAS | 0.99% | $207.50 | $209.55 |
|
29
|
73,024 M | SNPS | 0.45% | $457.28 | $459.36 |
|
30
|
32,890 M | CSGP | 0.43% | $76.25 | $76.58 |
|
31
|
59,638 M | ADSK | -0.26% | $274.21 | $273.49 |
|
32
|
41,130 M | VRSK | -0.81% | $296.91 | $294.51 |
|
33
|
46,198 M | ROST | -0.99% | $140.32 | $138.93 |
|
34
|
137,741 M | HON | -1.01% | $212.89 | $210.74 |
|
35
|
957,505 M | AVGO | -1.05% | $199.43 | $197.33 |
|
36
|
86,906 M | DASH | -1.13% | $198.44 | $196.20 |
|
37
|
124,276 M | PANW | -2.18% | $190.43 | $186.27 |
|
38
|
40,817 M | XEL | -2.36% | $72.10 | $70.40 |
|
39
|
160,514 M | AMD | -3.21% | $99.86 | $96.65 |
|
40
|
53,960 M | PAYX | -3.34% | $151.67 | $146.61 |
|
41
|
81,650 M | FTNT | -3.52% | $108.01 | $104.21 |
|
42
|
77,469 M | CEG | -3.96% | $250.55 | $240.62 |
|
43
|
28,903 M | ANSS | -4.06% | $333.25 | $319.73 |
|
44
|
214,156 M | LIN | -4.07% | $467.05 | $448.05 |
|
45
|
925,091 M | TSLA | -4.25% | $292.98 | $280.52 |
|
46
|
987 M | SQQQ | -4.43% | $31.40 | $30.01 |
|
47
|
92,326 M | KLAC | -4.59% | $708.84 | $676.31 |
|
48
|
60,784 M | ROP | -4.60% | $584.50 | $557.59 |
|
49
|
447,366 M | COST | -4.73% | $1,048.61 | $999.04 |
|
50
|
123,226 M | ADP | -5.23% | $315.18 | $298.69 |
|
51
|
1,990,463 M | GOOGL | -5.27% | $170.28 | $161.30 |
|
52
|
2,012,063 M | GOOG | -5.48% | $172.22 | $162.79 |
|
53
|
128,663 M | CMCSA | -5.74% | $35.88 | $33.82 |
|
54
|
126,010 M | AMAT | -5.76% | $158.07 | $148.96 |
|
55
|
271,438 M | ASML | -5.97% | $709.08 | $666.72 |
|
56
|
66,517 M | WDAY | -6.35% | $263.34 | $246.61 |
|
57
|
95,320 M | LRCX | -6.53% | $76.74 | $71.73 |
|
58
|
157,467 M | PDD | -6.79% | $113.69 | $105.97 |
|
59
|
33,897 M | KHC | -7.20% | $30.71 | $28.50 |
|
60
|
224,592 M | AZN | -7.48% | $76.21 | $70.51 |
|
61
|
151,214 M | AMGN | -7.88% | $308.06 | $283.78 |
|
62
|
65,393 M | PYPL | -7.94% | $71.05 | $65.41 |
|
63
|
282,590 M | TMUS | -8.41% | $269.69 | $247.00 |
|
64
|
36,260 M | DDOG | -8.78% | $116.55 | $106.32 |
|
65
|
21,983 M | CDW | -8.87% | $178.20 | $162.40 |
|
66
|
20,126 M | GFS | -9.26% | $38.77 | $35.18 |
|
67
|
236,032 M | CSCO | -9.34% | $64.11 | $58.12 |
|
68
|
129,082 M | GILD | -9.68% | $114.31 | $103.25 |
|
69
|
38,302 M | CTSH | -9.72% | $83.33 | $75.23 |
|
70
|
189,754 M | ISRG | -9.77% | $573.15 | $517.18 |
|
71
|
2,016,895 M | AMZN | -10.40% | $212.28 | $190.20 |
|
72
|
2,793,800 M | NVDA | -10.65% | $124.92 | $111.61 |
|
73
|
77,312 M | ABNB | -10.70% | $138.87 | $124.01 |
|
74
|
3,067,072 M | AAPL | -11.79% | $241.84 | $213.32 |
|
75
|
53,914 M | CSX | -12.18% | $32.01 | $28.11 |
|
76
|
129,927 M | ARM | -12.37% | $131.69 | $115.40 |
|
77
|
183,382 M | PEP | -12.98% | $153.47 | $133.55 |
|
78
|
68,697 M | MAR | -13.01% | $280.45 | $243.95 |
|
79
|
18,101 M | BIIB | -13.93% | $140.50 | $120.93 |
|
80
|
153,511 M | QCOM | -13.97% | $157.17 | $135.21 |
|
81
|
104,074 M | APP | -14.20% | $325.74 | $279.49 |
|
82
|
1,507,147 M | META | -14.37% | $668.20 | $572.21 |
|
83
|
162,327 M | ADBE | -14.58% | $438.56 | $374.63 |
|
84
|
33,521 M | ODFL | -14.70% | $176.50 | $150.56 |
|
85
|
40,233 M | FANG | -15.18% | $158.96 | $134.83 |
|
86
|
65,385 M | REGN | -15.56% | $698.74 | $590.00 |
|
87
|
47,530 M | NXPI | -15.65% | $215.59 | $181.84 |
|
88
|
98,496 M | ADI | -15.79% | $230.06 | $193.74 |
|
89
|
89,944 M | INTC | -15.80% | $23.73 | $19.98 |
|
90
|
17,688 M | ON | -15.83% | $47.05 | $39.60 |
|
91
|
47,194 M | PCAR | -16.28% | $107.24 | $89.78 |
|
92
|
90,210 M | MU | -16.94% | $93.63 | $77.77 |
|
93
|
36,757 M | BKR | -18.84% | $44.59 | $36.19 |
|
94
|
149,453 M | TXN | -19.25% | $195.99 | $158.26 |
|
95
|
54,622 M | TEAM | -19.42% | $284.26 | $229.07 |
|
96
|
32,004 M | DXCM | -20.49% | $88.37 | $70.26 |
|
97
|
25,767 M | MCHP | -21.88% | $58.86 | $45.98 |
|
98
|
32,292 M | GEHC | -22.53% | $87.35 | $67.67 |
|
99
|
26,589 M | TTD | -24.54% | $70.32 | $53.06 |
|
100
|
21,127 M | WBD | -26.44% | $11.46 | $8.43 |
|
101
|
34,744 M | LULU | -26.53% | $365.61 | $268.60 |
|
102
|
96,242 M | SBUX | -29.19% | $115.81 | $82.01 |
|
103
|
53,982 M | MRVL | -33.62% | $91.82 | $60.95 |
|
104
|
13,935 M | MDB | -35.61% | $267.43 | $172.19 |
Disclaimer: The information that Raincheck Fund provides is general in nature as it has been prepared without taking account of your objectives, financial situation or needs. It is not intended as legal, financial or investment advice and should not be construed or relied on as such. Raincheck Fund is for information purposes only. Raincheck Fund is not responsible for any damages or losses that may occur as a result of reliance on this information. Before making any commitment of a legal or financial nature you should seek advice from a qualified and registered legal practitioner or financial or investment adviser.
All content, group, messaging, tweets, newsletter, article, and email created by Raincheck Fund is intended for educational and information purposes only, is not financial, investment, legal or tax advice, and is a restatement, summary or extract of other data and research reports that are widely distributed and publicly available. Raincheck Fund is not a registered financial, investment, legal or tax advisor and is not liable for any financial loss you may incur acting on any information provided by Raincheck Fund.
Any investment advice, strategies, or recommendations presented through the Autopilot app are provided solely by Autopilot advisers LLC, an SEC registered investment advisor. Past performance does not guarantee future results. Investing carries risks, including the risk of the loss of principal.
Investing in securities involves significant risk, including the risk of loss of principal. Past performance does not guarantee future results, and there can be no assurance that any investment strategy or security will meet its objectives or achieve any specific financial outcome. You should only invest risk capital that you can afford to lose without impacting your financial stability. Carefully consider your individual financial situation, investment goals, and risk tolerance before making any investment decisions.