Nov. 21st 2025
Market Signal goes negative; indicates downtrend
After 139 consecutive days of positive values, the Market Signal went negative (-2 WEAK BEARISH) on Tues. Nov. 18th 2025.
The Market Signal continued to be negative in the following days, indicating the start of a downtrend.
Over the uptrend that just ended, TQQQ returned +73.26%. At its peak, return was +112.45%.
NASDAQ-100 52-week lows
The following NASDAQ-100 (QQQ) holdings closed at a 52-week low today:
MSTR $170.50 -3.74%
SQQQ (the inverse triple-leveraged (-3x) ETF for the NASDAQ-100) will be used in place of TQQQ in the next two sections benchmarking against QQQ and its holdings.Market Signal: -2 NEUTRAL/WEAK BEARISH
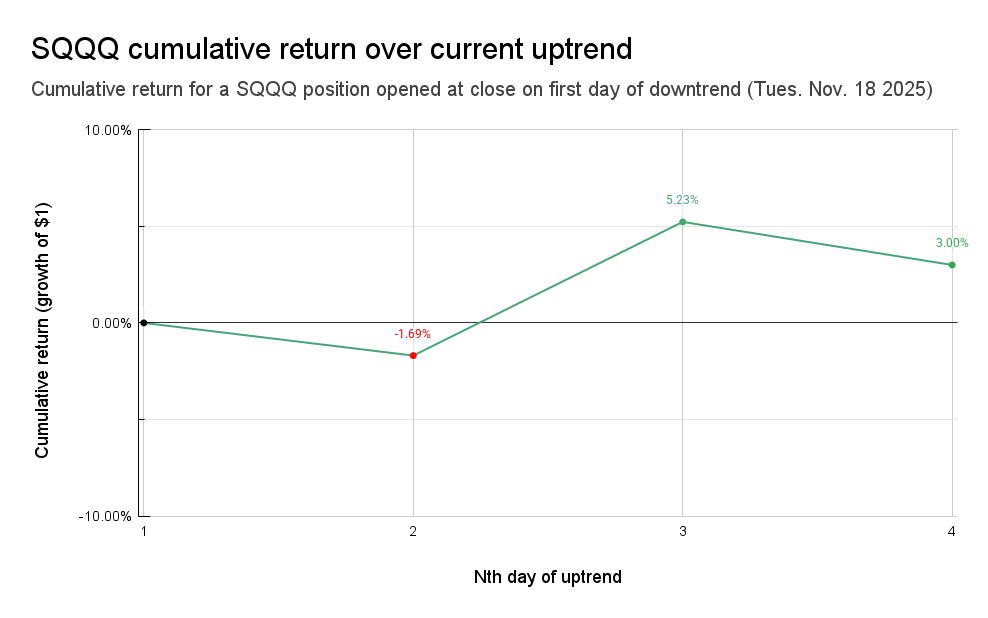
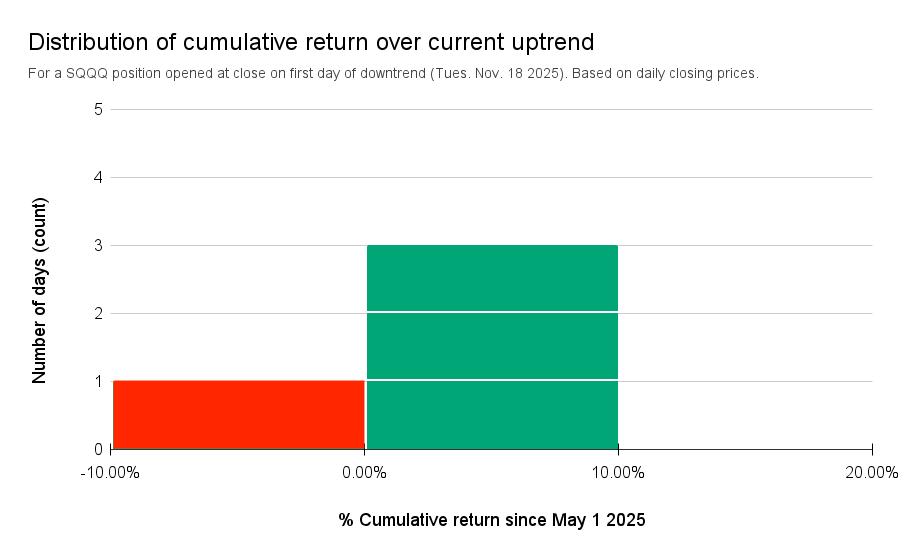
📉4th day of downtrend
Day 📉1 of current downtrend occurred on Tues. Nov. 18th 2025.
QQQ-1.05% since start of current downtrendSQQQ+3.00% since start of current downtrend

| A | B | C | D | E | F | G | |
|---|---|---|---|---|---|---|---|
|
1
|
Market Signal | Trend Count | QQQ Close | QQQ %chg since 📈1 | SQQQ close | SQQQ %chg since 📉1 | Date |
|
2
|
-2 | 📉1 | $596.31 | 0.00% | $76.90 | 0.00% | Tue 11/18/25 |
|
3
|
-3 | 📉2 | $599.87 | 0.60% | $75.60 | -1.69% | Wed 11/19/25 |
|
4
|
-3 | 📉3 | $585.67 | -1.78% | $80.92 | 5.23% | Thu 11/20/25 |
|
5
|
-2 | 📉4 | $590.07 | -1.05% | $79.21 | 3.00% | Fri 11/21/25 |
Market Signal, Trend Count, closing prices, and cumulative return (%) over current downtrend
SQQQ vs QQQ Holdings
SQQQ is outperforming 89% of QQQ holdings since day 📉1 of current downtrend (Nov. 18th 2025).
| A | B | C | D | E | |
|---|---|---|---|---|---|
|
1
|
Market Cap | Symbol | %Chg since 📉1 | Close on 📉1 | Close |
|
2
|
386,437 M | QQQ | -1.05% | $596.31 | $590.07 |
|
3
|
56,589 M | ROST | 8.82% | $159.90 | $174.00 |
|
4
|
57,965 M | IDXX | 8.31% | $670.21 | $725.91 |
|
5
|
34,825 M | GEHC | 7.65% | $71.02 | $76.45 |
|
6
|
54,091 M | PCAR | 6.18% | $97.00 | $102.99 |
|
7
|
36,671 M | CTSH | 5.90% | $71.75 | $75.98 |
|
8
|
3,615,997 M | GOOGL | 5.41% | $284.28 | $299.66 |
|
9
|
192,412 M | SHOP | 5.23% | $140.45 | $147.80 |
|
10
|
3,615,877 M | GOOG | 5.16% | $284.96 | $299.65 |
|
11
|
79,389 M | MAR | 4.57% | $282.90 | $295.84 |
|
12
|
79,445 M | REGN | 4.21% | $725.34 | $755.90 |
|
13
|
25,717 M | BIIB | 3.83% | $168.83 | $175.30 |
|
14
|
18,888 M | GFS | 3.47% | $32.85 | $33.99 |
|
15
|
2,796 M | SQQQ | 3.00% | $76.90 | $79.21 |
|
16
|
28,078 M | ODFL | 2.77% | $130.66 | $134.28 |
|
17
|
199,089 M | ISRG | 2.71% | $546.77 | $561.61 |
|
18
|
19,943 M | LULU | 2.57% | $163.97 | $168.18 |
|
19
|
18,791 M | ON | 2.50% | $45.56 | $46.70 |
|
20
|
97,051 M | SBUX | 2.42% | $83.33 | $85.35 |
|
21
|
73,550 M | MDLZ | 2.19% | $55.78 | $57.00 |
|
22
|
84,773 M | ORLY | 2.14% | $98.33 | $100.43 |
|
23
|
184,890 M | INTU | 2.07% | $649.73 | $663.15 |
|
24
|
48,234 M | BKR | 1.71% | $48.06 | $48.88 |
|
25
|
282,149 M | AZN | 1.62% | $89.55 | $91.00 |
|
26
|
4,011,632 M | AAPL | 1.51% | $267.44 | $271.49 |
|
27
|
48,158 M | NXPI | 1.46% | $188.59 | $191.35 |
|
28
|
102,374 M | ADP | 1.37% | $249.69 | $253.12 |
|
29
|
40,114 M | PAYX | 1.36% | $109.96 | $111.46 |
|
30
|
144,835 M | TXN | 1.32% | $157.32 | $159.40 |
|
31
|
29,935 M | KHC | 1.28% | $24.97 | $25.29 |
|
32
|
72,137 M | SNPS | 1.18% | $383.82 | $388.36 |
|
33
|
37,687 M | KDP | 1.17% | $27.42 | $27.74 |
|
34
|
26,270 M | CHTR | 1.15% | $200.69 | $203.00 |
|
35
|
74,667 M | CTAS | 1.03% | $183.91 | $185.80 |
|
36
|
114,291 M | ADI | 0.95% | $230.13 | $232.32 |
|
37
|
63,834 M | CSX | 0.85% | $33.99 | $34.28 |
|
38
|
40,909 M | CCEP | 0.75% | $90.25 | $90.93 |
|
39
|
28,502 M | CSGP | 0.66% | $66.81 | $67.25 |
|
40
|
164,565 M | INTC | 0.50% | $34.33 | $34.50 |
|
41
|
398,423 M | COST | 0.44% | $895.08 | $899.01 |
|
42
|
18,253 M | CDW | 0.28% | $139.81 | $140.20 |
|
43
|
23,491 M | DXCM | 0.10% | $60.17 | $60.23 |
|
44
|
31,102 M | VRSK | 0.09% | $222.96 | $223.16 |
|
45
|
27,509 M | MCHP | 0.06% | $50.87 | $50.90 |
|
46
|
99,661 M | CMCSA | -0.04% | $27.36 | $27.35 |
|
47
|
135,706 M | ADBE | -0.09% | $324.47 | $324.19 |
|
48
|
1,606,549 M | AVGO | -0.09% | $340.50 | $340.20 |
|
49
|
45,818 M | FAST | -0.13% | $39.96 | $39.91 |
|
50
|
47,764 M | ROP | -0.15% | $444.41 | $443.75 |
|
51
|
56,672 M | PYPL | -0.21% | $60.70 | $60.57 |
|
52
|
60,112 M | WDAY | -0.22% | $225.64 | $225.14 |
|
53
|
153,691 M | BKNG | -0.31% | $4,783.01 | $4,768.00 |
|
54
|
105,588 M | CEG | -0.37% | $339.35 | $338.11 |
|
55
|
179,173 M | LRCX | -0.41% | $143.24 | $142.65 |
|
56
|
157,120 M | GILD | -0.42% | $127.18 | $126.64 |
|
57
|
192,729 M | LIN | -0.48% | $414.72 | $412.74 |
|
58
|
61,940 M | ADSK | -0.49% | $292.23 | $290.80 |
|
59
|
60,054 M | TRI | -0.49% | $135.67 | $135.00 |
|
60
|
178,452 M | AMAT | -0.50% | $225.12 | $224.01 |
|
61
|
50,053 M | EA | -0.55% | $201.81 | $200.69 |
|
62
|
1,497,824 M | META | -0.58% | $597.69 | $594.25 |
|
63
|
120,641 M | HON | -0.75% | $191.45 | $190.02 |
|
64
|
2,359,224 M | AMZN | -0.84% | $222.55 | $220.69 |
|
65
|
81,818 M | CDNS | -0.87% | $303.21 | $300.58 |
|
66
|
69,282 M | ABNB | -1.01% | $115.42 | $114.26 |
|
67
|
174,894 M | QCOM | -1.07% | $165.06 | $163.30 |
|
68
|
175,824 M | APP | -1.09% | $526.01 | $520.26 |
|
69
|
70,385 M | MNST | -1.18% | $72.90 | $72.04 |
|
70
|
46,129 M | EXC | -1.36% | $46.38 | $45.75 |
|
71
|
4,347,678 M | NVDA | -1.37% | $181.36 | $178.88 |
|
72
|
39,420 M | CPRT | -1.43% | $41.32 | $40.73 |
|
73
|
43,510 M | TTWO | -1.51% | $239.09 | $235.47 |
|
74
|
66,770 M | MRVL | -1.56% | $78.68 | $77.45 |
|
75
|
58,640 M | FTNT | -1.62% | $80.15 | $78.86 |
|
76
|
300,678 M | CSCO | -1.64% | $77.37 | $76.10 |
|
77
|
200,083 M | PEP | -1.64% | $148.77 | $146.33 |
|
78
|
47,128 M | XEL | -1.64% | $81.00 | $79.67 |
|
79
|
38,488 M | TEAM | -1.66% | $148.75 | $146.28 |
|
80
|
234,305 M | TMUS | -1.69% | $213.08 | $209.48 |
|
81
|
181,759 M | AMGN | -1.88% | $343.99 | $337.54 |
|
82
|
108,277 M | VRTX | -2.01% | $435.52 | $426.76 |
|
83
|
19,175 M | TTD | -2.03% | $40.47 | $39.65 |
|
84
|
41,959 M | FANG | -2.10% | $149.58 | $146.44 |
|
85
|
64,540 M | AEP | -2.16% | $123.51 | $120.84 |
|
86
|
57,415 M | WBD | -2.20% | $23.69 | $23.17 |
|
87
|
41,190 M | AXON | -2.21% | $533.77 | $521.99 |
|
88
|
144,153 M | KLAC | -2.31% | $1,123.09 | $1,097.12 |
|
89
|
1,300,695 M | TSLA | -2.53% | $401.25 | $391.09 |
|
90
|
139,596 M | ARM | -3.29% | $136.04 | $131.57 |
|
91
|
375,172 M | ASML | -3.73% | $1,004.06 | $966.57 |
|
92
|
3,508,974 M | MSFT | -4.39% | $493.79 | $472.12 |
|
93
|
123,136 M | CRWD | -4.48% | $513.67 | $490.67 |
|
94
|
98,950 M | MELI | -5.20% | $2,058.81 | $1,951.78 |
|
95
|
160,761 M | PDD | -5.30% | $119.58 | $113.24 |
|
96
|
43,534 M | ZS | -6.18% | $293.11 | $275.01 |
|
97
|
369,075 M | PLTR | -7.46% | $167.33 | $154.85 |
|
98
|
441,995 M | NFLX | -8.57% | $114.09 | $104.31 |
|
99
|
127,481 M | PANW | -9.00% | $201.00 | $182.90 |
|
100
|
232,766 M | MU | -9.25% | $228.50 | $207.37 |
|
101
|
81,730 M | DASH | -10.59% | $212.08 | $189.63 |
|
102
|
55,248 M | DDOG | -10.72% | $176.46 | $157.55 |
|
103
|
331,762 M | AMD | -11.51% | $230.29 | $203.78 |
|
104
|
48,994 M | MSTR | -17.55% | $206.80 | $170.50 |
Assuming 3% for the risk-free rate, the Sharpe Ratio for this investment is 3.14.
Disclaimer: The information that Raincheck Fund provides is general in nature as it has been prepared without taking account of your objectives, financial situation or needs. It is not intended as legal, financial or investment advice and should not be construed or relied on as such. Raincheck Fund is for information purposes only. Raincheck Fund is not responsible for any damages or losses that may occur as a result of reliance on this information. Before making any commitment of a legal or financial nature you should seek advice from a qualified and registered legal practitioner or financial or investment adviser.
All content, group, messaging, tweets, newsletter, article, and email created by Raincheck Fund is intended for educational and information purposes only, is not financial, investment, legal or tax advice, and is a restatement, summary or extract of other data and research reports that are widely distributed and publicly available. Raincheck Fund is not a registered financial, investment, legal or tax advisor and is not liable for any financial loss you may incur acting on any information provided by Raincheck Fund.
Investment advice provided solely by Autopilot advisers LLC, an SEC registered investment advisor. Past performance does not guarantee future results. Investing carries risks, including the risk of the loss of principal.
Investing in securities involves significant risk, including the risk of loss of principal. Past performance does not guarantee future results, and there can be no assurance that any investment strategy or security will meet its objectives or achieve any specific financial outcome. You should only invest risk capital that you can afford to lose without impacting your financial stability. Carefully consider your individual financial situation, investment goals, and risk tolerance before making any investment decisions.