Nov. 14th 2025
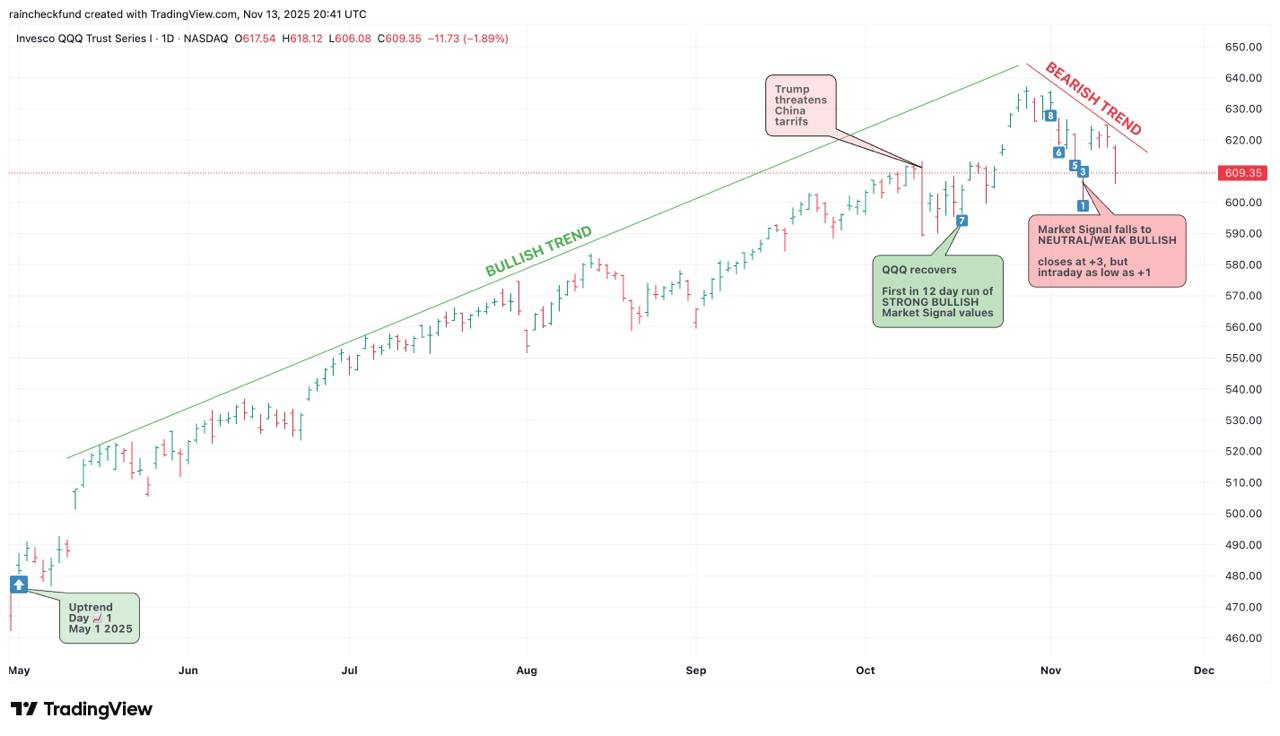
Market Signal in NEUTRAL/WEAK BULLISH range for second week in a row
Last week, the Market Signal began in STRONG BULLISH range and ended in NEUTRAL/WEAK BULLISH range. This week, it began in MODERATE BULLISH range and ended again in NEUTRAL/WEAK BULLISH territory.
Trepidation is on the rise alongside this bearish action. It's quite possible the uptrend ends next week.
Read more of our take in our X thread from this past Thursday:
Our Market Signal algorithm is giving ominous vibes. A bearish trend may be forming.
— Raincheck Fund (@RaincheckFund) November 13, 2025
Last week the Market Signal fell from STRONG BULLISH to NEUTRAL/WEAK BULLISH in a single week.
Last Friday, it fell closed at +3, but was as low as +1 (the weakest possible bullish value)… pic.twitter.com/8vDKxyqnNa
NASDAQ-100 52-week highs
The following NASDAQ-100 (QQQ) holdings closed at a 52-week high today:
CSCO $78.00 +0.80%AZN $89.10 +0.55%BIIB $167.55 +1.71%
Market Signal: +3 NEUTRAL/WEAK BULLISH
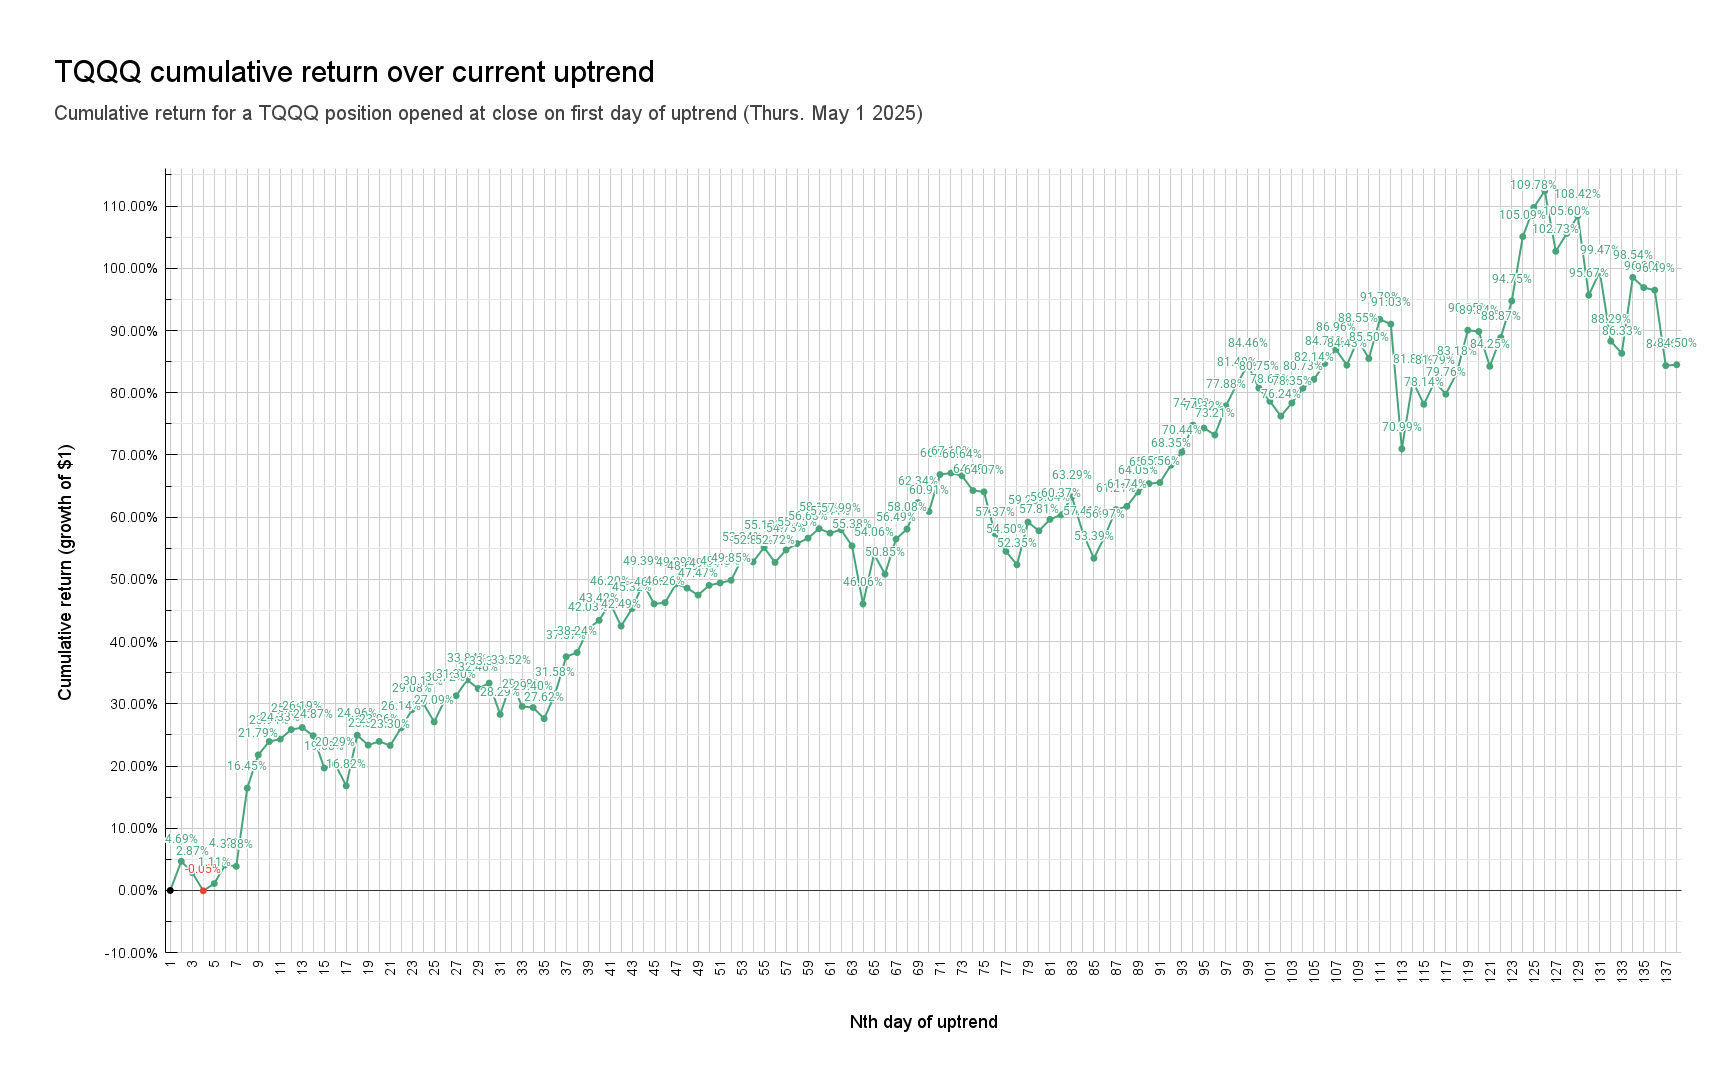
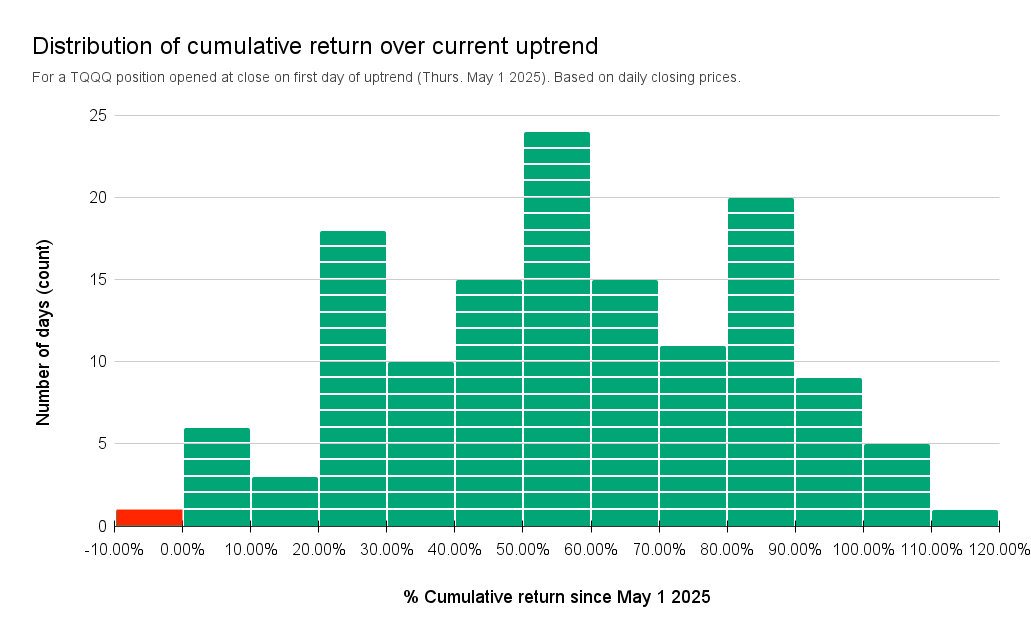
📈138th day of uptrend
Day 📈1 of current uptrend occurred on Thurs. May 1st 2025.
QQQ+26.40% since start of current uptrendTQQQ+84.50% since start of current uptrend
| A | B | C | D | E | F | G | |
|---|---|---|---|---|---|---|---|
|
1
|
Market Signal | Trend Count | QQQ Close | QQQ %chg since 📈1 | TQQQ close | TQQQ %chg since 📈1 | Date |
|
2
|
2 | 📈1 | $481.68 | 0.00% | $56.77 | 0.00% | Thu 5/1/25 |
|
3
|
2 | 📈2 | $488.83 | 1.48% | $59.43 | 4.69% | Fri 5/2/25 |
|
4
|
2 | 📈3 | $485.93 | 0.88% | $58.40 | 2.87% | Mon 5/5/25 |
|
5
|
2 | 📈4 | $481.41 | -0.06% | $56.74 | -0.05% | Tue 5/6/25 |
|
6
|
2 | 📈5 | $483.30 | 0.34% | $57.40 | 1.11% | Wed 5/7/25 |
|
7
|
2 | 📈6 | $488.29 | 1.37% | $59.11 | 4.12% | Thu 5/8/25 |
|
8
|
2 | 📈7 | $487.97 | 1.31% | $58.97 | 3.88% | Fri 5/9/25 |
|
9
|
3 | 📈8 | $507.85 | 5.43% | $66.11 | 16.45% | Mon 5/12/25 |
|
10
|
3 | 📈9 | $515.59 | 7.04% | $69.14 | 21.79% | Tue 5/13/25 |
|
11
|
3 | 📈10 | $518.68 | 7.68% | $70.36 | 23.94% | Wed 5/14/25 |
|
12
|
3 | 📈11 | $519.25 | 7.80% | $70.58 | 24.33% | Thu 5/15/25 |
|
13
|
3 | 📈12 | $521.51 | 8.27% | $71.45 | 25.86% | Fri 5/16/25 |
|
14
|
3 | 📈13 | $522.01 | 8.37% | $71.64 | 26.19% | Mon 5/19/25 |
|
15
|
3 | 📈14 | $520.27 | 8.01% | $70.89 | 24.87% | Tue 5/20/25 |
|
16
|
3 | 📈15 | $513.04 | 6.51% | $67.94 | 19.68% | Wed 5/21/25 |
|
17
|
2 | 📈16 | $514.00 | 6.71% | $68.29 | 20.29% | Thu 5/22/25 |
|
18
|
2 | 📈17 | $509.24 | 5.72% | $66.32 | 16.82% | Fri 5/23/25 |
|
19
|
4 | 📈18 | $521.22 | 8.21% | $70.94 | 24.96% | Tue 5/27/25 |
|
20
|
3 | 📈19 | $518.91 | 7.73% | $70.03 | 23.36% | Wed 5/28/25 |
|
21
|
3 | 📈20 | $519.93 | 7.94% | $70.37 | 23.96% | Thu 5/29/25 |
|
22
|
3 | 📈21 | $519.11 | 7.77% | $70.00 | 23.30% | Fri 5/30/25 |
|
23
|
4 | 📈22 | $523.21 | 8.62% | $71.61 | 26.14% | Mon 6/2/25 |
|
24
|
4 | 📈23 | $527.30 | 9.47% | $73.28 | 29.08% | Tue 6/3/25 |
|
25
|
3 | 📈24 | $528.77 | 9.78% | $73.87 | 30.12% | Wed 6/4/25 |
|
26
|
3 | 📈25 | $524.79 | 8.95% | $72.15 | 27.09% | Thu 6/5/25 |
|
27
|
4 | 📈26 | $529.92 | 10.01% | $74.21 | 30.72% | Fri 6/6/25 |
|
28
|
3 | 📈27 | $530.70 | 10.18% | $74.54 | 31.30% | Mon 6/9/25 |
|
29
|
3 | 📈28 | $534.21 | 10.91% | $75.98 | 33.84% | Tue 6/10/25 |
|
30
|
3 | 📈29 | $532.41 | 10.53% | $75.20 | 32.46% | Wed 6/11/25 |
|
31
|
3 | 📈30 | $533.66 | 10.79% | $75.69 | 33.33% | Thu 6/12/25 |
|
32
|
2 | 📈31 | $526.96 | 9.40% | $72.83 | 28.29% | Fri 6/13/25 |
|
33
|
3 | 📈32 | $534.29 | 10.92% | $75.80 | 33.52% | Mon 6/16/25 |
|
34
|
2 | 📈33 | $529.08 | 9.84% | $73.56 | 29.58% | Tue 6/17/25 |
|
35
|
2 | 📈34 | $528.99 | 9.82% | $73.46 | 29.40% | Wed 6/18/25 |
|
36
|
2 | 📈35 | $526.83 | 9.37% | $72.45 | 27.62% | Fri 6/20/25 |
|
37
|
7 | 📈36 | $531.65 | 10.37% | $74.70 | 31.58% | Mon 6/23/25 |
|
38
|
7 | 📈37 | $539.78 | 12.06% | $78.10 | 37.57% | Tue 6/24/25 |
|
39
|
7 | 📈38 | $541.16 | 12.35% | $78.48 | 38.24% | Wed 6/25/25 |
|
40
|
8 | 📈39 | $546.22 | 13.40% | $80.63 | 42.03% | Thu 6/26/25 |
|
41
|
7 | 📈40 | $548.09 | 13.79% | $81.42 | 43.42% | Fri 6/27/25 |
|
42
|
8 | 📈41 | $551.64 | 14.52% | $83.00 | 46.20% | Mon 6/30/25 |
|
43
|
7 | 📈42 | $546.99 | 13.56% | $80.89 | 42.49% | Tue 7/1/25 |
|
44
|
7 | 📈43 | $550.80 | 14.35% | $82.50 | 45.32% | Wed 7/2/25 |
|
45
|
8 | 📈44 | $556.22 | 15.48% | $84.81 | 49.39% | Thu 7/3/25 |
|
46
|
7 | 📈45 | $552.03 | 14.61% | $82.92 | 46.06% | Mon 7/7/25 |
|
47
|
7 | 📈46 | $552.34 | 14.67% | $83.03 | 46.26% | Tue 7/8/25 |
|
48
|
7 | 📈47 | $556.25 | 15.48% | $84.75 | 49.29% | Wed 7/9/25 |
|
49
|
7 | 📈48 | $555.45 | 15.32% | $84.36 | 48.60% | Thu 7/10/25 |
|
50
|
7 | 📈49 | $554.20 | 15.06% | $83.72 | 47.47% | Fri 7/11/25 |
|
51
|
7 | 📈50 | $556.21 | 15.47% | $84.61 | 49.04% | Mon 7/14/25 |
|
52
|
7 | 📈51 | $556.72 | 15.58% | $84.83 | 49.43% | Tue 7/15/25 |
|
53
|
7 | 📈52 | $557.29 | 15.70% | $85.07 | 49.85% | Wed 7/16/25 |
|
54
|
7 | 📈53 | $561.80 | 16.63% | $87.05 | 53.34% | Thu 7/17/25 |
|
55
|
7 | 📈54 | $561.26 | 16.52% | $86.75 | 52.81% | Fri 7/18/25 |
|
56
|
7 | 📈55 | $564.17 | 17.13% | $88.07 | 55.13% | Mon 7/21/25 |
|
57
|
7 | 📈56 | $561.25 | 16.52% | $86.70 | 52.72% | Tue 7/22/25 |
|
58
|
7 | 📈57 | $563.81 | 17.05% | $87.84 | 54.73% | Wed 7/23/25 |
|
59
|
7 | 📈58 | $565.01 | 17.30% | $88.42 | 55.75% | Thu 7/24/25 |
|
60
|
7 | 📈59 | $566.37 | 17.58% | $88.92 | 56.63% | Fri 7/25/25 |
|
61
|
7 | 📈60 | $568.14 | 17.95% | $89.79 | 58.16% | Mon 7/28/25 |
|
62
|
7 | 📈61 | $567.26 | 17.77% | $89.38 | 57.44% | Tue 7/29/25 |
|
63
|
7 | 📈62 | $568.02 | 17.92% | $89.69 | 57.99% | Wed 7/30/25 |
|
64
|
6 | 📈63 | $565.01 | 17.30% | $88.21 | 55.38% | Thu 7/31/25 |
|
65
|
5 | 📈64 | $553.88 | 14.99% | $82.92 | 46.06% | Fri 8/1/25 |
|
66
|
7 | 📈65 | $564.10 | 17.11% | $87.46 | 54.06% | Mon 8/4/25 |
|
67
|
6 | 📈66 | $560.27 | 16.32% | $85.64 | 50.85% | Tue 8/5/25 |
|
68
|
7 | 📈67 | $567.32 | 17.78% | $88.84 | 56.49% | Wed 8/6/25 |
|
69
|
7 | 📈68 | $569.24 | 18.18% | $89.74 | 58.08% | Thu 8/7/25 |
|
70
|
7 | 📈69 | $574.55 | 19.28% | $92.16 | 62.34% | Fri 8/8/25 |
|
71
|
7 | 📈70 | $572.85 | 18.93% | $91.35 | 60.91% | Mon 8/11/25 |
|
72
|
7 | 📈71 | $580.05 | 20.42% | $94.72 | 66.85% | Tue 8/12/25 |
|
73
|
7 | 📈72 | $580.34 | 20.48% | $94.86 | 67.10% | Wed 8/13/25 |
|
74
|
7 | 📈73 | $579.89 | 20.39% | $94.60 | 66.64% | Thu 8/14/25 |
|
75
|
7 | 📈74 | $577.34 | 19.86% | $93.26 | 64.28% | Fri 8/15/25 |
|
76
|
7 | 📈75 | $577.11 | 19.81% | $93.14 | 64.07% | Mon 8/18/25 |
|
77
|
6 | 📈76 | $569.28 | 18.19% | $89.34 | 57.37% | Tue 8/19/25 |
|
78
|
5 | 📈77 | $565.90 | 17.48% | $87.71 | 54.50% | Wed 8/20/25 |
|
79
|
5 | 📈78 | $563.28 | 16.94% | $86.49 | 52.35% | Thu 8/21/25 |
|
80
|
6 | 📈79 | $571.97 | 18.74% | $90.38 | 59.20% | Fri 8/22/25 |
|
81
|
6 | 📈80 | $570.32 | 18.40% | $89.59 | 57.81% | Mon 8/25/25 |
|
82
|
6 | 📈81 | $572.61 | 18.88% | $90.63 | 59.64% | Tue 8/26/25 |
|
83
|
7 | 📈82 | $573.49 | 19.06% | $91.04 | 60.37% | Wed 8/27/25 |
|
84
|
7 | 📈83 | $577.08 | 19.81% | $92.70 | 63.29% | Thu 8/28/25 |
|
85
|
5 | 📈84 | $570.40 | 18.42% | $89.36 | 57.41% | Fri 8/29/25 |
|
86
|
5 | 📈85 | $565.62 | 17.43% | $87.08 | 53.39% | Tue 9/2/25 |
|
87
|
6.5 | 📈86 | $570.07 | 18.35% | $89.11 | 56.97% | Wed 9/3/25 |
|
88
|
7 | 📈87 | $575.23 | 19.42% | $91.52 | 61.21% | Thu 9/4/25 |
|
89
|
7 | 📈88 | $576.06 | 19.59% | $91.82 | 61.74% | Fri 9/5/25 |
|
90
|
7 | 📈89 | $578.87 | 20.18% | $93.13 | 64.05% | Mon 9/8/25 |
|
91
|
7 | 📈90 | $580.51 | 20.52% | $93.89 | 65.39% | Tue 9/9/25 |
|
92
|
7 | 📈91 | $580.70 | 20.56% | $93.99 | 65.56% | Wed 9/10/25 |
|
93
|
7 | 📈92 | $584.08 | 21.26% | $95.57 | 68.35% | Thu 9/11/25 |
|
94
|
7 | 📈93 | $586.66 | 21.79% | $96.76 | 70.44% | Fri 9/12/25 |
|
95
|
7 | 📈94 | $591.68 | 22.84% | $99.23 | 74.79% | Mon 9/15/25 |
|
96
|
7 | 📈95 | $591.18 | 22.73% | $98.96 | 74.32% | Tue 9/16/25 |
|
97
|
7 | 📈96 | $590.00 | 22.49% | $98.33 | 73.21% | Wed 9/17/25 |
|
98
|
7 | 📈97 | $595.32 | 23.59% | $100.98 | 77.88% | Thu 9/18/25 |
|
99
|
7 | 📈98 | $599.35 | 24.43% | $102.98 | 81.40% | Fri 9/19/25 |
|
100
|
7 | 📈99 | $602.20 | 25.02% | $104.72 | 84.46% | Mon 9/22/25 |
|
101
|
7 | 📈100 | $598.20 | 24.19% | $102.61 | 80.75% | Tue 9/23/25 |
|
102
|
7 | 📈101 | $596.10 | 23.75% | $101.41 | 78.63% | Wed 9/24/25 |
|
103
|
6 | 📈102 | $593.53 | 23.22% | $100.05 | 76.24% | Thu 9/25/25 |
|
104
|
7 | 📈103 | $595.97 | 23.73% | $101.25 | 78.35% | Fri 9/26/25 |
|
105
|
7 | 📈104 | $598.73 | 24.30% | $102.60 | 80.73% | Mon 9/29/25 |
|
106
|
7 | 📈105 | $600.37 | 24.64% | $103.40 | 82.14% | Tue 9/30/25 |
|
107
|
7 | 📈106 | $603.25 | 25.24% | $104.86 | 84.71% | Wed 10/1/25 |
|
108
|
8 | 📈107 | $605.73 | 25.75% | $106.14 | 86.96% | Thu 10/2/25 |
|
109
|
7 | 📈108 | $603.18 | 25.22% | $104.70 | 84.43% | Fri 10/3/25 |
|
110
|
8 | 📈109 | $607.71 | 26.16% | $107.04 | 88.55% | Mon 10/6/25 |
|
111
|
7 | 📈110 | $604.51 | 25.50% | $105.31 | 85.50% | Tue 10/7/25 |
|
112
|
8 | 📈111 | $611.44 | 26.94% | $108.88 | 91.79% | Wed 10/8/25 |
|
113
|
7 | 📈112 | $610.70 | 26.79% | $108.45 | 91.03% | Thu 10/9/25 |
|
114
|
5 | 📈113 | $589.50 | 22.38% | $97.07 | 70.99% | Fri 10/10/25 |
|
115
|
4 | 📈114 | $602.01 | 24.98% | $103.23 | 81.84% | Mon 10/13/25 |
|
116
|
6 | 📈115 | $598.00 | 24.15% | $101.13 | 78.14% | Tue 10/14/25 |
|
117
|
6 | 📈116 | $602.22 | 25.02% | $103.20 | 81.79% | Wed 10/15/25 |
|
118
|
6 | 📈117 | $599.99 | 24.56% | $102.05 | 79.76% | Thu 10/16/25 |
|
119
|
7 | 📈118 | $603.93 | 25.38% | $103.99 | 83.18% | Fri 10/17/25 |
|
120
|
8 | 📈119 | $611.54 | 26.96% | $107.89 | 90.05% | Mon 10/20/25 |
|
121
|
7 | 📈120 | $611.38 | 26.93% | $107.77 | 89.84% | Tue 10/21/25 |
|
122
|
7 | 📈121 | $605.49 | 25.70% | $104.60 | 84.25% | Wed 10/22/25 |
|
123
|
7 | 📈122 | $610.58 | 26.76% | $107.22 | 88.87% | Thu 10/23/25 |
|
124
|
8 | 📈123 | $617.10 | 28.11% | $110.56 | 94.75% | Fri 10/24/25 |
|
125
|
8 | 📈124 | $628.09 | 30.40% | $116.43 | 105.09% | Mon 10/27/25 |
|
126
|
8 | 📈125 | $632.92 | 31.40% | $119.09 | 109.78% | Tue 10/28/25 |
|
127
|
8 | 📈126 | $635.77 | 31.99% | $120.61 | 112.45% | Wed 10/29/25 |
|
128
|
7 | 📈127 | $626.05 | 29.97% | $115.09 | 102.73% | Thu 10/30/25 |
|
129
|
7 | 📈128 | $629.07 | 30.60% | $116.72 | 105.60% | Fri 10/31/25 |
|
130
|
8 | 📈129 | $632.08 | 31.22% | $118.32 | 108.42% | Mon 11/3/25 |
|
131
|
6 | 📈130 | $619.25 | 28.56% | $111.08 | 95.67% | Tue 11/4/25 |
|
132
|
6 | 📈131 | $623.28 | 29.40% | $113.24 | 99.47% | Wed 11/5/25 |
|
133
|
5 | 📈132 | $611.67 | 26.99% | $106.89 | 88.29% | Thu 11/6/25 |
|
134
|
3 | 📈133 | $609.74 | 26.59% | $105.78 | 86.33% | Fri 11/7/25 |
|
135
|
6 | 📈134 | $623.23 | 29.39% | $112.71 | 98.54% | Mon 11/10/25 |
|
136
|
6 | 📈135 | $621.57 | 29.04% | $111.78 | 96.90% | Tue 11/11/25 |
|
137
|
6 | 📈136 | $621.08 | 28.94% | $111.55 | 96.49% | Wed 11/12/25 |
|
138
|
5 | 📈137 | $608.40 | 26.31% | $104.66 | 84.36% | Thu 11/13/25 |
|
139
|
3 | 📈138 | $608.86 | 26.40% | $104.74 | 84.50% | Fri 11/14/25 |
Market Signal, Trend Count, closing prices, and cumulative return (%) over current uptrend
TQQQ vs QQQ Holdings
TQQQ is outperforming 95% of QQQ holdings since day 📈1 of current uptrend (Thurs. May 1st 2025), including all of the Magnificent 7
| A | B | C | D | E | |
|---|---|---|---|---|---|
|
1
|
Market Cap | Symbol | %Chg since 📈1 | Close on 📈1 | Close |
|
2
|
397,586 M | QQQ | 26.40% | $481.68 | $608.86 |
|
3
|
277,058 M | MU | 217.38% | $77.77 | $246.83 |
|
4
|
57,068 M | WBD | 173.19% | $8.43 | $23.03 |
|
5
|
401,817 M | AMD | 155.36% | $96.65 | $246.81 |
|
6
|
186,219 M | LRCX | 106.69% | $71.73 | $148.26 |
|
7
|
188,478 M | APP | 99.54% | $279.49 | $557.70 |
|
8
|
28,866 M | TQQQ | 84.50% | $56.77 | $104.74 |
|
9
|
169,430 M | INTC | 77.78% | $19.98 | $35.52 |
|
10
|
64,878 M | DDOG | 74.01% | $106.32 | $185.01 |
|
11
|
1,617,221 M | AVGO | 73.55% | $197.33 | $342.46 |
|
12
|
3,335,439 M | GOOGL | 71.36% | $161.30 | $276.41 |
|
13
|
4,630,069 M | NVDA | 70.39% | $111.61 | $190.17 |
|
14
|
3,342,318 M | GOOG | 70.15% | $162.79 | $276.98 |
|
15
|
149,041 M | KLAC | 67.72% | $676.31 | $1,134.32 |
|
16
|
180,049 M | AMAT | 51.73% | $148.96 | $226.01 |
|
17
|
390,857 M | ASML | 51.03% | $666.72 | $1,006.98 |
|
18
|
190,121 M | SHOP | 50.54% | $97.01 | $146.04 |
|
19
|
414,742 M | PLTR | 49.75% | $116.20 | $174.01 |
|
20
|
55,092 M | IDXX | 46.36% | $471.38 | $689.93 |
|
21
|
1,344,795 M | TSLA | 44.14% | $280.52 | $404.35 |
|
22
|
74,529 M | MRVL | 41.84% | $60.95 | $86.45 |
|
23
|
105,716 M | CEG | 40.69% | $240.62 | $338.52 |
|
24
|
50,145 M | EA | 38.57% | $145.10 | $201.06 |
|
25
|
24,580 M | BIIB | 38.55% | $120.93 | $167.55 |
|
26
|
48,085 M | BKR | 34.65% | $36.19 | $48.73 |
|
27
|
307,377 M | CSCO | 34.21% | $58.12 | $78.00 |
|
28
|
47,403 M | ZS | 31.88% | $227.06 | $299.45 |
|
29
|
186,333 M | QCOM | 28.67% | $135.21 | $173.98 |
|
30
|
4,025,226 M | AAPL | 27.70% | $213.32 | $272.41 |
|
31
|
276,258 M | AZN | 26.37% | $70.51 | $89.10 |
|
32
|
134,901 M | CRWD | 24.47% | $431.88 | $537.55 |
|
33
|
64,989 M | CSX | 24.16% | $28.11 | $34.90 |
|
34
|
185,903 M | PDD | 23.57% | $105.97 | $130.95 |
|
35
|
2,508,887 M | AMZN | 23.39% | $190.20 | $234.69 |
|
36
|
115,555 M | ADI | 21.24% | $193.74 | $234.89 |
|
37
|
148,296 M | ARM | 21.12% | $115.40 | $139.77 |
|
38
|
155,110 M | GILD | 21.08% | $103.25 | $125.02 |
|
39
|
3,791,850 M | MSFT | 19.93% | $425.40 | $510.18 |
|
40
|
69,671 M | MNST | 19.81% | $59.52 | $71.31 |
|
41
|
181,328 M | AMGN | 18.66% | $283.78 | $336.74 |
|
42
|
19,189 M | ON | 18.48% | $39.60 | $46.92 |
|
43
|
72,886 M | REGN | 17.54% | $590.00 | $693.50 |
|
44
|
76,673 M | MAR | 17.12% | $243.95 | $285.72 |
|
45
|
28,903 M | MCHP | 16.31% | $45.98 | $53.48 |
|
46
|
52,225 M | ROST | 15.58% | $138.93 | $160.58 |
|
47
|
47,666 M | XEL | 14.46% | $70.40 | $80.58 |
|
48
|
64,928 M | AEP | 12.80% | $107.54 | $121.30 |
|
49
|
42,750 M | FANG | 10.66% | $134.83 | $149.20 |
|
50
|
140,387 M | PANW | 10.19% | $186.27 | $205.25 |
|
51
|
63,770 M | ADSK | 9.47% | $273.49 | $299.39 |
|
52
|
199,427 M | PEP | 9.21% | $133.55 | $145.85 |
|
53
|
49,605 M | NXPI | 8.39% | $181.84 | $197.10 |
|
54
|
33,321 M | GEHC | 8.10% | $67.67 | $73.15 |
|
55
|
1,536,161 M | META | 6.51% | $572.21 | $609.46 |
|
56
|
50,204 M | PCAR | 6.47% | $89.78 | $95.59 |
|
57
|
184,683 M | INTU | 6.29% | $623.19 | $662.41 |
|
58
|
194,799 M | ISRG | 6.25% | $517.18 | $549.51 |
|
59
|
89,199 M | DASH | 5.48% | $196.20 | $206.96 |
|
60
|
83,397 M | ORLY | 5.28% | $93.85 | $98.80 |
|
61
|
85,724 M | CDNS | 5.07% | $299.73 | $314.93 |
|
62
|
96,386 M | SBUX | 3.38% | $82.01 | $84.78 |
|
63
|
40,697 M | CCEP | 0.92% | $89.54 | $90.36 |
|
64
|
144,771 M | TXN | 0.68% | $158.26 | $159.33 |
|
65
|
46,438 M | FAST | 0.24% | $40.35 | $40.45 |
|
66
|
126,368 M | HON | 0.21% | $198.62 | $199.04 |
|
67
|
43,429 M | TTWO | -0.06% | $235.17 | $235.03 |
|
68
|
162,717 M | BKNG | -1.05% | $5,101.43 | $5,048.01 |
|
69
|
46,321 M | EXC | -1.42% | $46.60 | $45.94 |
|
70
|
73,987 M | ABNB | -1.60% | $124.01 | $122.02 |
|
71
|
471,262 M | NFLX | -1.88% | $1,133.47 | $1,112.17 |
|
72
|
35,050 M | CTSH | -3.47% | $75.23 | $72.62 |
|
73
|
58,768 M | PYPL | -3.97% | $65.41 | $62.81 |
|
74
|
197,702 M | LIN | -5.50% | $448.05 | $423.39 |
|
75
|
18,365 M | GFS | -6.05% | $35.18 | $33.05 |
|
76
|
61,629 M | WDAY | -6.40% | $246.61 | $230.82 |
|
77
|
409,046 M | COST | -7.61% | $999.04 | $922.98 |
|
78
|
18,888 M | CDW | -10.67% | $162.40 | $145.08 |
|
79
|
103,873 M | MELI | -10.71% | $2,294.52 | $2,048.89 |
|
80
|
43,746 M | AXON | -10.74% | $621.10 | $554.37 |
|
81
|
75,037 M | CTAS | -10.89% | $209.55 | $186.72 |
|
82
|
28,841 M | CSGP | -11.14% | $76.58 | $68.05 |
|
83
|
138,603 M | ADBE | -11.62% | $374.63 | $331.11 |
|
84
|
27,662 M | ODFL | -12.13% | $150.56 | $132.29 |
|
85
|
110,913 M | VRTX | -12.37% | $498.86 | $437.15 |
|
86
|
241,687 M | TMUS | -12.52% | $247.00 | $216.08 |
|
87
|
29,414 M | KHC | -12.81% | $28.50 | $24.85 |
|
88
|
72,410 M | SNPS | -15.14% | $459.36 | $389.83 |
|
89
|
102,362 M | ADP | -15.27% | $298.69 | $253.09 |
|
90
|
73,370 M | MDLZ | -16.22% | $67.87 | $56.86 |
|
91
|
22,644 M | DXCM | -17.36% | $70.26 | $58.06 |
|
92
|
100,244 M | CMCSA | -18.66% | $33.82 | $27.51 |
|
93
|
48,383 M | ROP | -19.39% | $557.59 | $449.50 |
|
94
|
36,858 M | KDP | -20.30% | $34.04 | $27.13 |
|
95
|
20,277 M | TTD | -20.98% | $53.06 | $41.93 |
|
96
|
61,210 M | FTNT | -21.02% | $104.21 | $82.31 |
|
97
|
40,344 M | PAYX | -23.54% | $146.61 | $112.10 |
|
98
|
62,781 M | TRI | -24.02% | $185.74 | $141.13 |
|
99
|
30,082 M | VRSK | -26.71% | $294.51 | $215.84 |
|
100
|
39,759 M | CPRT | -32.10% | $60.50 | $41.08 |
|
101
|
39,938 M | TEAM | -33.74% | $229.07 | $151.79 |
|
102
|
20,240 M | LULU | -36.46% | $268.60 | $170.68 |
|
103
|
26,283 M | CHTR | -46.97% | $383.00 | $203.10 |
|
104
|
57,399 M | MSTR | -47.65% | $381.60 | $199.75 |
Assuming 3% for the risk-free rate, the Sharpe Ratio for this investment is 2.67.
Disclaimer: The information that Raincheck Fund provides is general in nature as it has been prepared without taking account of your objectives, financial situation or needs. It is not intended as legal, financial or investment advice and should not be construed or relied on as such. Raincheck Fund is for information purposes only. Raincheck Fund is not responsible for any damages or losses that may occur as a result of reliance on this information. Before making any commitment of a legal or financial nature you should seek advice from a qualified and registered legal practitioner or financial or investment adviser.
All content, group, messaging, tweets, newsletter, article, and email created by Raincheck Fund is intended for educational and information purposes only, is not financial, investment, legal or tax advice, and is a restatement, summary or extract of other data and research reports that are widely distributed and publicly available. Raincheck Fund is not a registered financial, investment, legal or tax advisor and is not liable for any financial loss you may incur acting on any information provided by Raincheck Fund.
Investment advice provided solely by Autopilot advisers LLC, an SEC registered investment advisor. Past performance does not guarantee future results. Investing carries risks, including the risk of the loss of principal.
Investing in securities involves significant risk, including the risk of loss of principal. Past performance does not guarantee future results, and there can be no assurance that any investment strategy or security will meet its objectives or achieve any specific financial outcome. You should only invest risk capital that you can afford to lose without impacting your financial stability. Carefully consider your individual financial situation, investment goals, and risk tolerance before making any investment decisions.