Nov. 7th 2025
QQQ gives back 💸
This was the worst week for the NASDAQ-100 (QQQ) since Liberation Day. The index fell -3.07% this week, while TQQQ fell -9.37%.
More than 10% of QQQ holdings closed at 52-week lows yesterday. Today 5% of the index closed at 52-week lows. Both are signs of weakness.
The University of Michigan Consumer Sentiment index fell to its second-lowest reading of all-time:
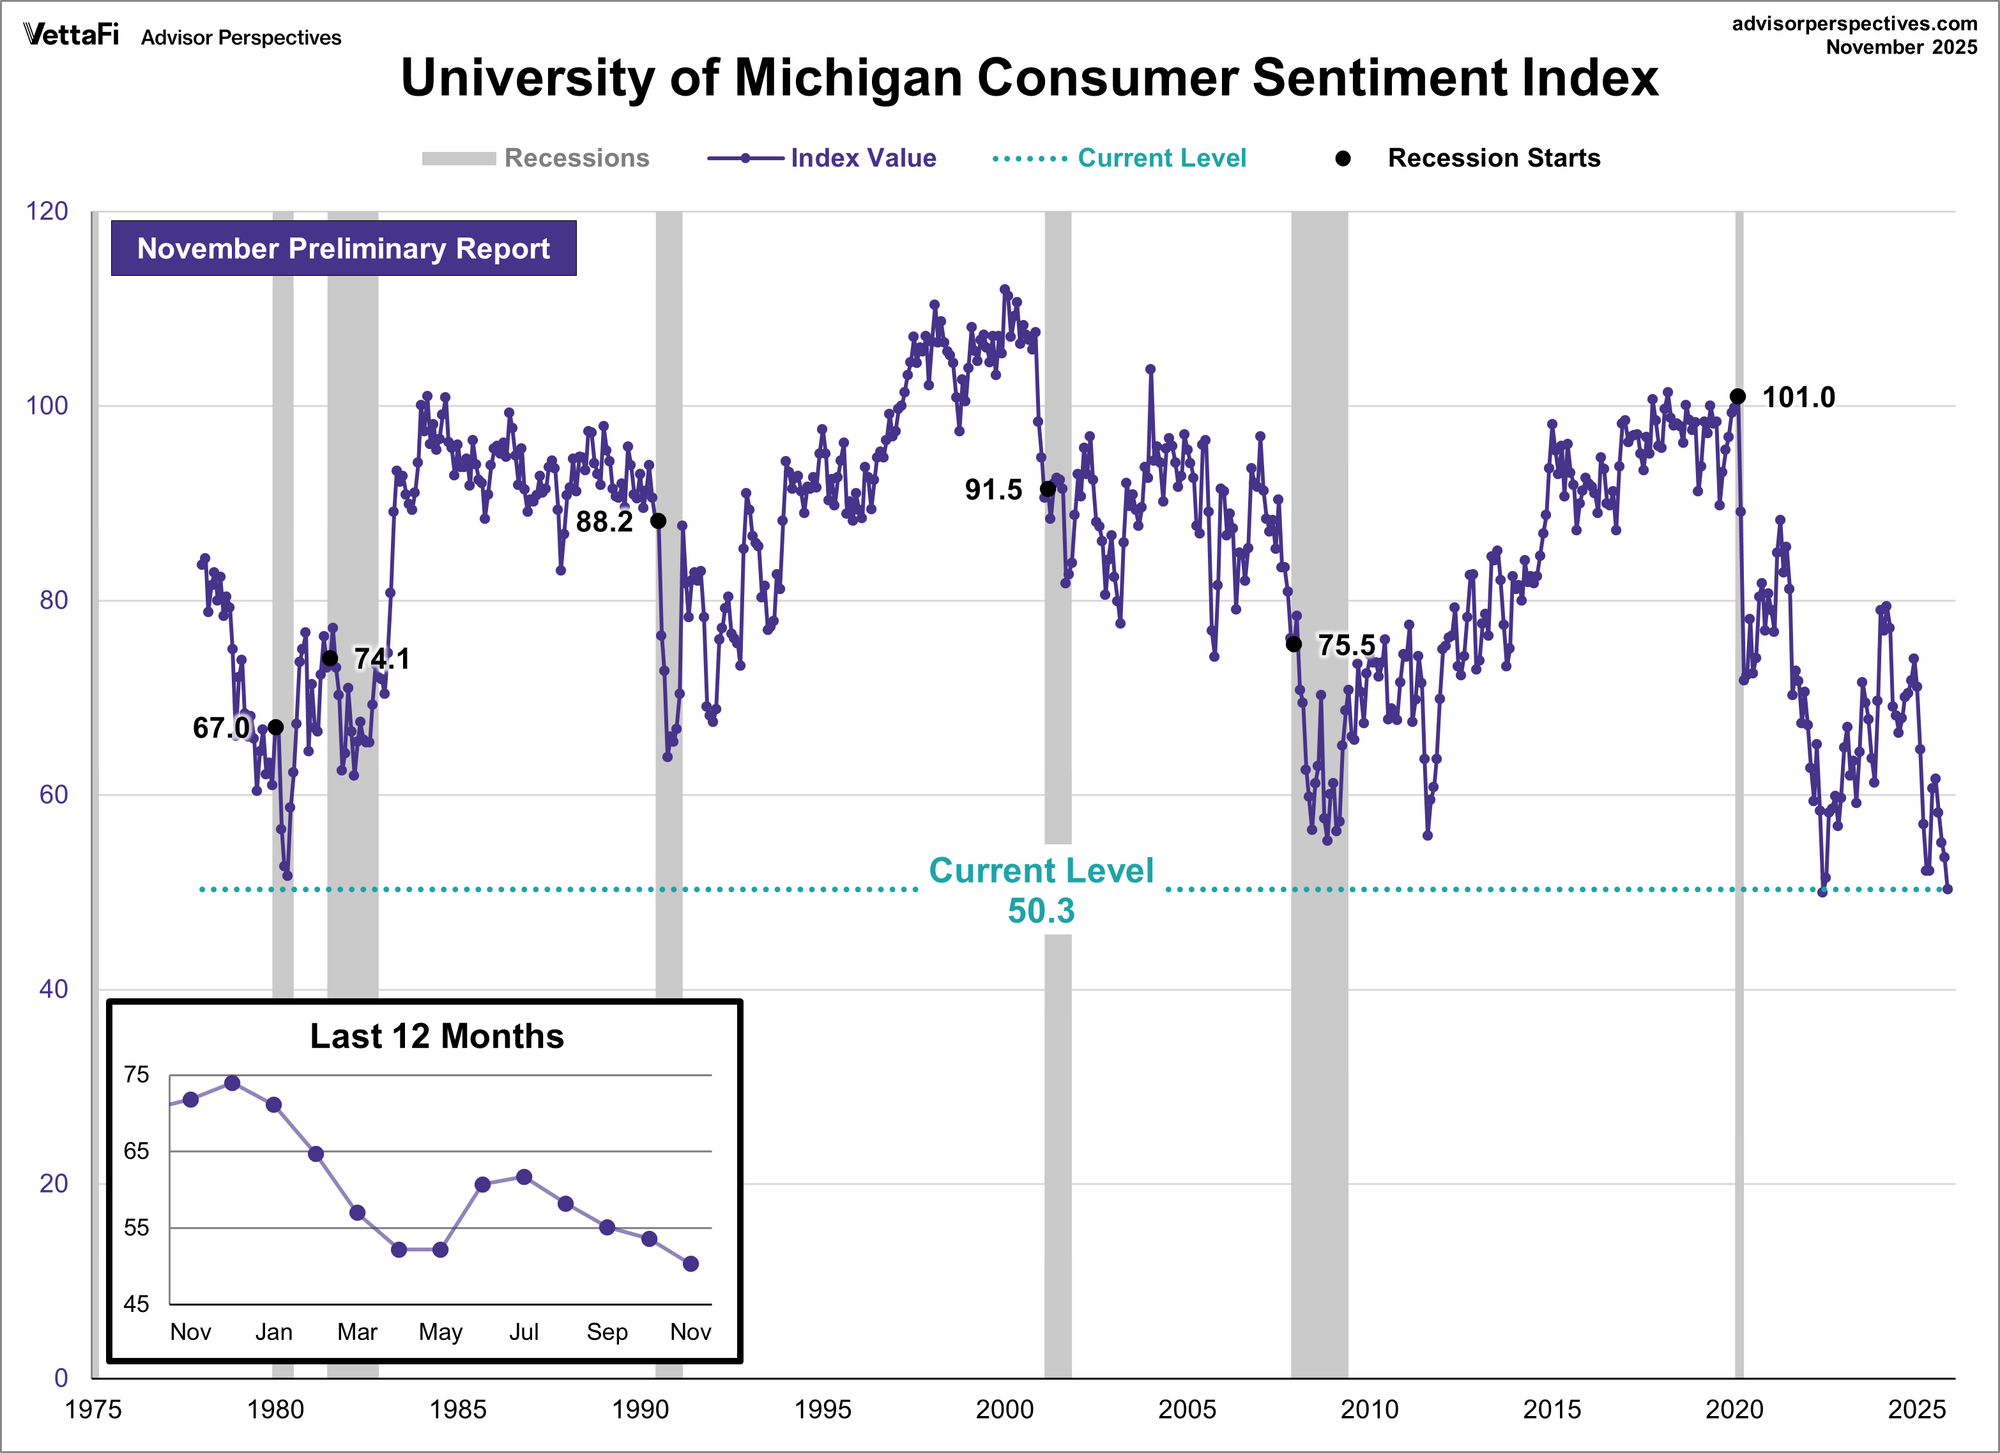

Sources: AdvisorPerspectives & WSJ
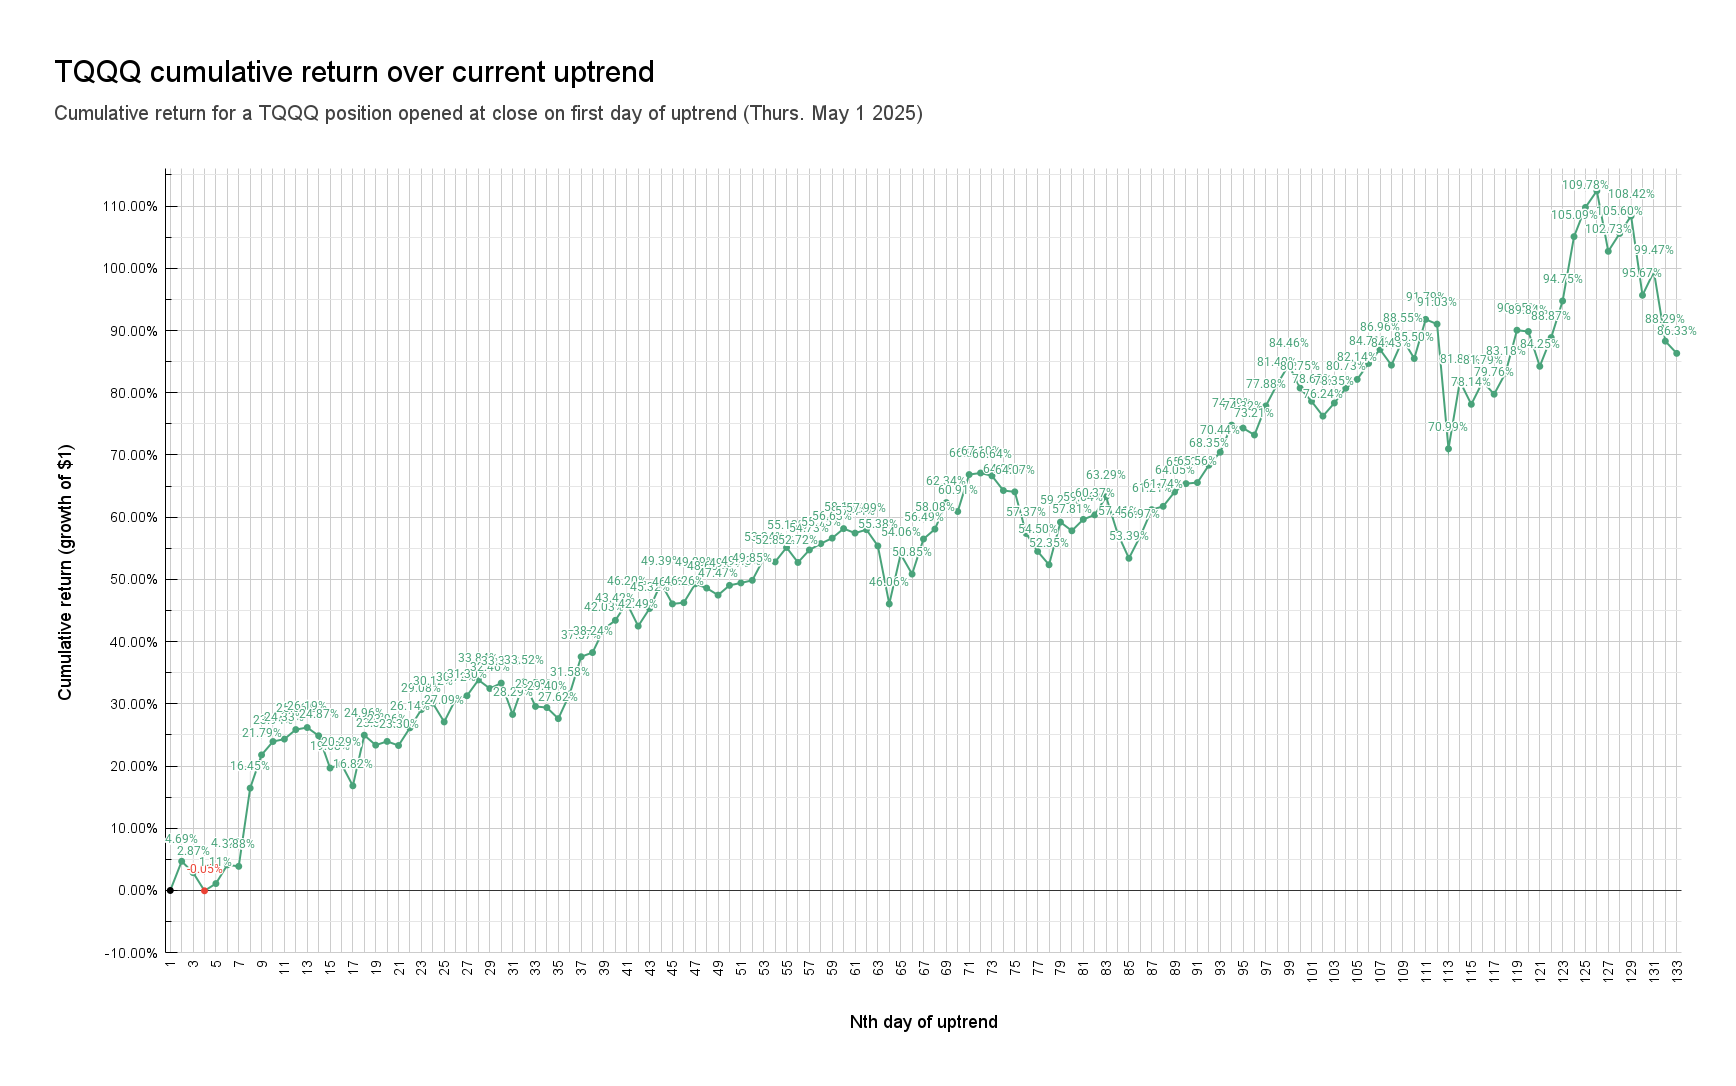
At 133 days, this has been longest uptrend on record since Raincheck Fund began. Valuations are extended, and we've seen TQQQ cross above +100% return since the uptrend began.
The Market Signal finished the day at +3 NEUTRAL/WEAK BULLISH, but was as low as +1 NEUTRAL/WEAK BULLISH at Friday's intraday low (QQQ $598.67). ⚠️ A value of +1 is the weakest possible bullish signal (anything else is 0 or bearish) ⚠️.
The abrupt decline in Market Signal strength indicates the uptrend is losing steam, and suggests it may be in jeopardy.
NASDAQ-100 52-week highs
The following NASDAQ-100 (QQQ) holdings closed at a 52-week high today:
DDOG $191.24 +0.22%
Market Signal: +3 NEUTRAL/WEAK BULLISH
📈133rd day of uptrend
Day 📈1 of current uptrend occurred on Thurs. May 1st 2025.
QQQ+26.59% since start of current uptrendTQQQ+86.33% since start of current uptrend
| A | B | C | D | E | F | G | |
|---|---|---|---|---|---|---|---|
|
1
|
Market Signal | Trend Count | QQQ Close | QQQ %chg since 📈1 | TQQQ close | TQQQ %chg since 📈1 | Date |
|
2
|
2 | 📈1 | $481.68 | 0.00% | $56.77 | 0.00% | Thu 5/1/25 |
|
3
|
2 | 📈2 | $488.83 | 1.48% | $59.43 | 4.69% | Fri 5/2/25 |
|
4
|
2 | 📈3 | $485.93 | 0.88% | $58.40 | 2.87% | Mon 5/5/25 |
|
5
|
2 | 📈4 | $481.41 | -0.06% | $56.74 | -0.05% | Tue 5/6/25 |
|
6
|
2 | 📈5 | $483.30 | 0.34% | $57.40 | 1.11% | Wed 5/7/25 |
|
7
|
2 | 📈6 | $488.29 | 1.37% | $59.11 | 4.12% | Thu 5/8/25 |
|
8
|
2 | 📈7 | $487.97 | 1.31% | $58.97 | 3.88% | Fri 5/9/25 |
|
9
|
3 | 📈8 | $507.85 | 5.43% | $66.11 | 16.45% | Mon 5/12/25 |
|
10
|
3 | 📈9 | $515.59 | 7.04% | $69.14 | 21.79% | Tue 5/13/25 |
|
11
|
3 | 📈10 | $518.68 | 7.68% | $70.36 | 23.94% | Wed 5/14/25 |
|
12
|
3 | 📈11 | $519.25 | 7.80% | $70.58 | 24.33% | Thu 5/15/25 |
|
13
|
3 | 📈12 | $521.51 | 8.27% | $71.45 | 25.86% | Fri 5/16/25 |
|
14
|
3 | 📈13 | $522.01 | 8.37% | $71.64 | 26.19% | Mon 5/19/25 |
|
15
|
3 | 📈14 | $520.27 | 8.01% | $70.89 | 24.87% | Tue 5/20/25 |
|
16
|
3 | 📈15 | $513.04 | 6.51% | $67.94 | 19.68% | Wed 5/21/25 |
|
17
|
2 | 📈16 | $514.00 | 6.71% | $68.29 | 20.29% | Thu 5/22/25 |
|
18
|
2 | 📈17 | $509.24 | 5.72% | $66.32 | 16.82% | Fri 5/23/25 |
|
19
|
4 | 📈18 | $521.22 | 8.21% | $70.94 | 24.96% | Tue 5/27/25 |
|
20
|
3 | 📈19 | $518.91 | 7.73% | $70.03 | 23.36% | Wed 5/28/25 |
|
21
|
3 | 📈20 | $519.93 | 7.94% | $70.37 | 23.96% | Thu 5/29/25 |
|
22
|
3 | 📈21 | $519.11 | 7.77% | $70.00 | 23.30% | Fri 5/30/25 |
|
23
|
4 | 📈22 | $523.21 | 8.62% | $71.61 | 26.14% | Mon 6/2/25 |
|
24
|
4 | 📈23 | $527.30 | 9.47% | $73.28 | 29.08% | Tue 6/3/25 |
|
25
|
3 | 📈24 | $528.77 | 9.78% | $73.87 | 30.12% | Wed 6/4/25 |
|
26
|
3 | 📈25 | $524.79 | 8.95% | $72.15 | 27.09% | Thu 6/5/25 |
|
27
|
4 | 📈26 | $529.92 | 10.01% | $74.21 | 30.72% | Fri 6/6/25 |
|
28
|
3 | 📈27 | $530.70 | 10.18% | $74.54 | 31.30% | Mon 6/9/25 |
|
29
|
3 | 📈28 | $534.21 | 10.91% | $75.98 | 33.84% | Tue 6/10/25 |
|
30
|
3 | 📈29 | $532.41 | 10.53% | $75.20 | 32.46% | Wed 6/11/25 |
|
31
|
3 | 📈30 | $533.66 | 10.79% | $75.69 | 33.33% | Thu 6/12/25 |
|
32
|
2 | 📈31 | $526.96 | 9.40% | $72.83 | 28.29% | Fri 6/13/25 |
|
33
|
3 | 📈32 | $534.29 | 10.92% | $75.80 | 33.52% | Mon 6/16/25 |
|
34
|
2 | 📈33 | $529.08 | 9.84% | $73.56 | 29.58% | Tue 6/17/25 |
|
35
|
2 | 📈34 | $528.99 | 9.82% | $73.46 | 29.40% | Wed 6/18/25 |
|
36
|
2 | 📈35 | $526.83 | 9.37% | $72.45 | 27.62% | Fri 6/20/25 |
|
37
|
7 | 📈36 | $531.65 | 10.37% | $74.70 | 31.58% | Mon 6/23/25 |
|
38
|
7 | 📈37 | $539.78 | 12.06% | $78.10 | 37.57% | Tue 6/24/25 |
|
39
|
7 | 📈38 | $541.16 | 12.35% | $78.48 | 38.24% | Wed 6/25/25 |
|
40
|
8 | 📈39 | $546.22 | 13.40% | $80.63 | 42.03% | Thu 6/26/25 |
|
41
|
7 | 📈40 | $548.09 | 13.79% | $81.42 | 43.42% | Fri 6/27/25 |
|
42
|
8 | 📈41 | $551.64 | 14.52% | $83.00 | 46.20% | Mon 6/30/25 |
|
43
|
7 | 📈42 | $546.99 | 13.56% | $80.89 | 42.49% | Tue 7/1/25 |
|
44
|
7 | 📈43 | $550.80 | 14.35% | $82.50 | 45.32% | Wed 7/2/25 |
|
45
|
8 | 📈44 | $556.22 | 15.48% | $84.81 | 49.39% | Thu 7/3/25 |
|
46
|
7 | 📈45 | $552.03 | 14.61% | $82.92 | 46.06% | Mon 7/7/25 |
|
47
|
7 | 📈46 | $552.34 | 14.67% | $83.03 | 46.26% | Tue 7/8/25 |
|
48
|
7 | 📈47 | $556.25 | 15.48% | $84.75 | 49.29% | Wed 7/9/25 |
|
49
|
7 | 📈48 | $555.45 | 15.32% | $84.36 | 48.60% | Thu 7/10/25 |
|
50
|
7 | 📈49 | $554.20 | 15.06% | $83.72 | 47.47% | Fri 7/11/25 |
|
51
|
7 | 📈50 | $556.21 | 15.47% | $84.61 | 49.04% | Mon 7/14/25 |
|
52
|
7 | 📈51 | $556.72 | 15.58% | $84.83 | 49.43% | Tue 7/15/25 |
|
53
|
7 | 📈52 | $557.29 | 15.70% | $85.07 | 49.85% | Wed 7/16/25 |
|
54
|
7 | 📈53 | $561.80 | 16.63% | $87.05 | 53.34% | Thu 7/17/25 |
|
55
|
7 | 📈54 | $561.26 | 16.52% | $86.75 | 52.81% | Fri 7/18/25 |
|
56
|
7 | 📈55 | $564.17 | 17.13% | $88.07 | 55.13% | Mon 7/21/25 |
|
57
|
7 | 📈56 | $561.25 | 16.52% | $86.70 | 52.72% | Tue 7/22/25 |
|
58
|
7 | 📈57 | $563.81 | 17.05% | $87.84 | 54.73% | Wed 7/23/25 |
|
59
|
7 | 📈58 | $565.01 | 17.30% | $88.42 | 55.75% | Thu 7/24/25 |
|
60
|
7 | 📈59 | $566.37 | 17.58% | $88.92 | 56.63% | Fri 7/25/25 |
|
61
|
7 | 📈60 | $568.14 | 17.95% | $89.79 | 58.16% | Mon 7/28/25 |
|
62
|
7 | 📈61 | $567.26 | 17.77% | $89.38 | 57.44% | Tue 7/29/25 |
|
63
|
7 | 📈62 | $568.02 | 17.92% | $89.69 | 57.99% | Wed 7/30/25 |
|
64
|
6 | 📈63 | $565.01 | 17.30% | $88.21 | 55.38% | Thu 7/31/25 |
|
65
|
5 | 📈64 | $553.88 | 14.99% | $82.92 | 46.06% | Fri 8/1/25 |
|
66
|
7 | 📈65 | $564.10 | 17.11% | $87.46 | 54.06% | Mon 8/4/25 |
|
67
|
6 | 📈66 | $560.27 | 16.32% | $85.64 | 50.85% | Tue 8/5/25 |
|
68
|
7 | 📈67 | $567.32 | 17.78% | $88.84 | 56.49% | Wed 8/6/25 |
|
69
|
7 | 📈68 | $569.24 | 18.18% | $89.74 | 58.08% | Thu 8/7/25 |
|
70
|
7 | 📈69 | $574.55 | 19.28% | $92.16 | 62.34% | Fri 8/8/25 |
|
71
|
7 | 📈70 | $572.85 | 18.93% | $91.35 | 60.91% | Mon 8/11/25 |
|
72
|
7 | 📈71 | $580.05 | 20.42% | $94.72 | 66.85% | Tue 8/12/25 |
|
73
|
7 | 📈72 | $580.34 | 20.48% | $94.86 | 67.10% | Wed 8/13/25 |
|
74
|
7 | 📈73 | $579.89 | 20.39% | $94.60 | 66.64% | Thu 8/14/25 |
|
75
|
7 | 📈74 | $577.34 | 19.86% | $93.26 | 64.28% | Fri 8/15/25 |
|
76
|
7 | 📈75 | $577.11 | 19.81% | $93.14 | 64.07% | Mon 8/18/25 |
|
77
|
6 | 📈76 | $569.28 | 18.19% | $89.34 | 57.37% | Tue 8/19/25 |
|
78
|
5 | 📈77 | $565.90 | 17.48% | $87.71 | 54.50% | Wed 8/20/25 |
|
79
|
5 | 📈78 | $563.28 | 16.94% | $86.49 | 52.35% | Thu 8/21/25 |
|
80
|
6 | 📈79 | $571.97 | 18.74% | $90.38 | 59.20% | Fri 8/22/25 |
|
81
|
6 | 📈80 | $570.32 | 18.40% | $89.59 | 57.81% | Mon 8/25/25 |
|
82
|
6 | 📈81 | $572.61 | 18.88% | $90.63 | 59.64% | Tue 8/26/25 |
|
83
|
7 | 📈82 | $573.49 | 19.06% | $91.04 | 60.37% | Wed 8/27/25 |
|
84
|
7 | 📈83 | $577.08 | 19.81% | $92.70 | 63.29% | Thu 8/28/25 |
|
85
|
5 | 📈84 | $570.40 | 18.42% | $89.36 | 57.41% | Fri 8/29/25 |
|
86
|
5 | 📈85 | $565.62 | 17.43% | $87.08 | 53.39% | Tue 9/2/25 |
|
87
|
6.5 | 📈86 | $570.07 | 18.35% | $89.11 | 56.97% | Wed 9/3/25 |
|
88
|
7 | 📈87 | $575.23 | 19.42% | $91.52 | 61.21% | Thu 9/4/25 |
|
89
|
7 | 📈88 | $576.06 | 19.59% | $91.82 | 61.74% | Fri 9/5/25 |
|
90
|
7 | 📈89 | $578.87 | 20.18% | $93.13 | 64.05% | Mon 9/8/25 |
|
91
|
7 | 📈90 | $580.51 | 20.52% | $93.89 | 65.39% | Tue 9/9/25 |
|
92
|
7 | 📈91 | $580.70 | 20.56% | $93.99 | 65.56% | Wed 9/10/25 |
|
93
|
7 | 📈92 | $584.08 | 21.26% | $95.57 | 68.35% | Thu 9/11/25 |
|
94
|
7 | 📈93 | $586.66 | 21.79% | $96.76 | 70.44% | Fri 9/12/25 |
|
95
|
7 | 📈94 | $591.68 | 22.84% | $99.23 | 74.79% | Mon 9/15/25 |
|
96
|
7 | 📈95 | $591.18 | 22.73% | $98.96 | 74.32% | Tue 9/16/25 |
|
97
|
7 | 📈96 | $590.00 | 22.49% | $98.33 | 73.21% | Wed 9/17/25 |
|
98
|
7 | 📈97 | $595.32 | 23.59% | $100.98 | 77.88% | Thu 9/18/25 |
|
99
|
7 | 📈98 | $599.35 | 24.43% | $102.98 | 81.40% | Fri 9/19/25 |
|
100
|
7 | 📈99 | $602.20 | 25.02% | $104.72 | 84.46% | Mon 9/22/25 |
|
101
|
7 | 📈100 | $598.20 | 24.19% | $102.61 | 80.75% | Tue 9/23/25 |
|
102
|
7 | 📈101 | $596.10 | 23.75% | $101.41 | 78.63% | Wed 9/24/25 |
|
103
|
6 | 📈102 | $593.53 | 23.22% | $100.05 | 76.24% | Thu 9/25/25 |
|
104
|
7 | 📈103 | $595.97 | 23.73% | $101.25 | 78.35% | Fri 9/26/25 |
|
105
|
7 | 📈104 | $598.73 | 24.30% | $102.60 | 80.73% | Mon 9/29/25 |
|
106
|
7 | 📈105 | $600.37 | 24.64% | $103.40 | 82.14% | Tue 9/30/25 |
|
107
|
7 | 📈106 | $603.25 | 25.24% | $104.86 | 84.71% | Wed 10/1/25 |
|
108
|
8 | 📈107 | $605.73 | 25.75% | $106.14 | 86.96% | Thu 10/2/25 |
|
109
|
7 | 📈108 | $603.18 | 25.22% | $104.70 | 84.43% | Fri 10/3/25 |
|
110
|
8 | 📈109 | $607.71 | 26.16% | $107.04 | 88.55% | Mon 10/6/25 |
|
111
|
7 | 📈110 | $604.51 | 25.50% | $105.31 | 85.50% | Tue 10/7/25 |
|
112
|
8 | 📈111 | $611.44 | 26.94% | $108.88 | 91.79% | Wed 10/8/25 |
|
113
|
7 | 📈112 | $610.70 | 26.79% | $108.45 | 91.03% | Thu 10/9/25 |
|
114
|
5 | 📈113 | $589.50 | 22.38% | $97.07 | 70.99% | Fri 10/10/25 |
|
115
|
4 | 📈114 | $602.01 | 24.98% | $103.23 | 81.84% | Mon 10/13/25 |
|
116
|
6 | 📈115 | $598.00 | 24.15% | $101.13 | 78.14% | Tue 10/14/25 |
|
117
|
6 | 📈116 | $602.22 | 25.02% | $103.20 | 81.79% | Wed 10/15/25 |
|
118
|
6 | 📈117 | $599.99 | 24.56% | $102.05 | 79.76% | Thu 10/16/25 |
|
119
|
7 | 📈118 | $603.93 | 25.38% | $103.99 | 83.18% | Fri 10/17/25 |
|
120
|
8 | 📈119 | $611.54 | 26.96% | $107.89 | 90.05% | Mon 10/20/25 |
|
121
|
7 | 📈120 | $611.38 | 26.93% | $107.77 | 89.84% | Tue 10/21/25 |
|
122
|
7 | 📈121 | $605.49 | 25.70% | $104.60 | 84.25% | Wed 10/22/25 |
|
123
|
7 | 📈122 | $610.58 | 26.76% | $107.22 | 88.87% | Thu 10/23/25 |
|
124
|
8 | 📈123 | $617.10 | 28.11% | $110.56 | 94.75% | Fri 10/24/25 |
|
125
|
8 | 📈124 | $628.09 | 30.40% | $116.43 | 105.09% | Mon 10/27/25 |
|
126
|
8 | 📈125 | $632.92 | 31.40% | $119.09 | 109.78% | Tue 10/28/25 |
|
127
|
8 | 📈126 | $635.77 | 31.99% | $120.61 | 112.45% | Wed 10/29/25 |
|
128
|
7 | 📈127 | $626.05 | 29.97% | $115.09 | 102.73% | Thu 10/30/25 |
|
129
|
7 | 📈128 | $629.07 | 30.60% | $116.72 | 105.60% | Fri 10/31/25 |
|
130
|
8 | 📈129 | $632.08 | 31.22% | $118.32 | 108.42% | Mon 11/3/25 |
|
131
|
6 | 📈130 | $619.25 | 28.56% | $111.08 | 95.67% | Tue 11/4/25 |
|
132
|
6 | 📈131 | $623.28 | 29.40% | $113.24 | 99.47% | Wed 11/5/25 |
|
133
|
5 | 📈132 | $611.67 | 26.99% | $106.89 | 88.29% | Thu 11/6/25 |
|
134
|
3 | 📈133 | $609.74 | 26.59% | $105.78 | 86.33% | Fri 11/7/25 |
Market Signal, Trend Count, closing prices, and cumulative return (%) over current uptrend
TQQQ vs QQQ Holdings
TQQQ is outperforming 94% of QQQ holdings since day 📈1 of current uptrend (Thurs. May 1st 2025), including all of the Magnificent 7.
| A | B | C | D | E | |
|---|---|---|---|---|---|
|
1
|
Market Cap | Symbol | %Chg since 📈1 | Close on 📈1 | Close |
|
2
|
399,654 M | QQQ | 26.59% | $481.68 | $609.74 |
|
3
|
267,057 M | MU | 205.93% | $77.77 | $237.92 |
|
4
|
56,176 M | WBD | 168.92% | $8.43 | $22.67 |
|
5
|
380,213 M | AMD | 141.63% | $96.65 | $233.54 |
|
6
|
200,148 M | LRCX | 122.15% | $71.73 | $159.35 |
|
7
|
209,508 M | APP | 121.81% | $279.49 | $619.93 |
|
8
|
181,880 M | INTC | 90.84% | $19.98 | $38.13 |
|
9
|
28,434 M | TQQQ | 86.33% | $56.77 | $105.78 |
|
10
|
66,694 M | DDOG | 79.87% | $106.32 | $191.24 |
|
11
|
1,650,136 M | AVGO | 77.08% | $197.33 | $349.43 |
|
12
|
156,800 M | KLAC | 76.45% | $676.31 | $1,193.37 |
|
13
|
3,364,642 M | GOOGL | 72.86% | $161.30 | $278.83 |
|
14
|
3,375,140 M | GOOG | 71.82% | $162.79 | $279.70 |
|
15
|
4,580,888 M | NVDA | 68.58% | $111.61 | $188.15 |
|
16
|
198,414 M | SHOP | 57.11% | $97.01 | $152.41 |
|
17
|
183,284 M | AMAT | 54.45% | $148.96 | $230.07 |
|
18
|
424,085 M | PLTR | 53.12% | $116.20 | $177.93 |
|
19
|
1,428,506 M | TSLA | 53.12% | $280.52 | $429.52 |
|
20
|
394,731 M | ASML | 52.53% | $666.72 | $1,016.96 |
|
21
|
56,571 M | IDXX | 50.29% | $471.38 | $708.45 |
|
22
|
78,382 M | MRVL | 49.17% | $60.95 | $90.92 |
|
23
|
111,963 M | CEG | 48.95% | $240.62 | $358.39 |
|
24
|
50,658 M | ZS | 40.94% | $227.06 | $320.01 |
|
25
|
50,031 M | EA | 38.25% | $145.10 | $200.60 |
|
26
|
47,237 M | BKR | 32.27% | $36.19 | $47.87 |
|
27
|
161,675 M | ARM | 32.05% | $115.40 | $152.38 |
|
28
|
22,814 M | BIIB | 28.60% | $120.93 | $155.51 |
|
29
|
2,612,796 M | AMZN | 28.50% | $190.20 | $244.41 |
|
30
|
192,760 M | PDD | 28.13% | $105.97 | $135.78 |
|
31
|
183,023 M | QCOM | 26.39% | $135.21 | $170.89 |
|
32
|
3,967,007 M | AAPL | 25.85% | $213.32 | $268.47 |
|
33
|
65,808 M | CSX | 25.72% | $28.11 | $35.34 |
|
34
|
135,468 M | CRWD | 24.99% | $431.88 | $539.81 |
|
35
|
30,373 M | MCHP | 22.40% | $45.98 | $56.28 |
|
36
|
280,067 M | CSCO | 22.28% | $58.12 | $71.07 |
|
37
|
19,561 M | ON | 20.78% | $39.60 | $47.83 |
|
38
|
262,244 M | AZN | 19.95% | $70.51 | $84.58 |
|
39
|
78,133 M | MAR | 19.35% | $243.95 | $291.16 |
|
40
|
112,402 M | ADI | 17.93% | $193.74 | $228.48 |
|
41
|
68,086 M | MNST | 17.15% | $59.52 | $69.73 |
|
42
|
3,692,554 M | MSFT | 16.79% | $425.40 | $496.82 |
|
43
|
52,387 M | ROST | 15.94% | $138.93 | $161.08 |
|
44
|
147,599 M | GILD | 15.10% | $103.25 | $118.84 |
|
45
|
47,861 M | XEL | 14.93% | $70.40 | $80.91 |
|
46
|
143,690 M | PANW | 13.97% | $186.27 | $212.29 |
|
47
|
64,997 M | AEP | 12.92% | $107.54 | $121.43 |
|
48
|
172,422 M | AMGN | 12.83% | $283.78 | $320.20 |
|
49
|
51,483 M | NXPI | 12.49% | $181.84 | $204.56 |
|
50
|
69,106 M | REGN | 11.45% | $590.00 | $657.53 |
|
51
|
51,832 M | PCAR | 9.92% | $89.78 | $98.69 |
|
52
|
63,299 M | ADSK | 8.66% | $273.49 | $297.18 |
|
53
|
1,567,037 M | META | 8.65% | $572.21 | $621.71 |
|
54
|
88,479 M | CDNS | 8.45% | $299.73 | $325.05 |
|
55
|
198,518 M | ISRG | 8.28% | $517.18 | $560.00 |
|
56
|
33,276 M | GEHC | 7.95% | $67.67 | $73.05 |
|
57
|
195,461 M | PEP | 7.04% | $133.55 | $142.95 |
|
58
|
41,159 M | FANG | 6.54% | $134.83 | $143.65 |
|
59
|
97,285 M | SBUX | 4.34% | $82.01 | $85.57 |
|
60
|
87,280 M | DASH | 4.13% | $196.20 | $204.31 |
|
61
|
180,903 M | INTU | 4.12% | $623.19 | $648.85 |
|
62
|
82,141 M | ORLY | 3.46% | $93.85 | $97.09 |
|
63
|
41,209 M | CCEP | 2.09% | $89.54 | $91.41 |
|
64
|
145,879 M | TXN | 1.45% | $158.26 | $160.55 |
|
65
|
61,959 M | PYPL | 1.24% | $65.41 | $66.22 |
|
66
|
46,897 M | FAST | 1.23% | $40.35 | $40.85 |
|
67
|
46,593 M | EXC | -0.84% | $46.60 | $46.21 |
|
68
|
42,797 M | TTWO | -1.35% | $235.17 | $232.00 |
|
69
|
123,213 M | HON | -2.26% | $0.00 | $194.07 |
|
70
|
74,007 M | ABNB | -2.52% | $124.01 | $120.88 |
|
71
|
467,656 M | NFLX | -2.63% | $1,133.47 | $1,103.66 |
|
72
|
35,330 M | CTSH | -2.70% | $75.23 | $73.20 |
|
73
|
47,544 M | AXON | -2.99% | $621.10 | $602.51 |
|
74
|
18,913 M | GFS | -3.13% | $35.18 | $34.08 |
|
75
|
159,235 M | BKNG | -3.16% | $5,101.43 | $4,940.00 |
|
76
|
196,357 M | LIN | -6.15% | $448.05 | $420.51 |
|
77
|
29,403 M | ODFL | -7.08% | $150.56 | $139.90 |
|
78
|
408,939 M | COST | -7.64% | $999.04 | $922.74 |
|
79
|
106,900 M | MELI | -8.10% | $2,294.52 | $2,108.60 |
|
80
|
60,120 M | WDAY | -8.69% | $246.61 | $225.17 |
|
81
|
74,373 M | CTAS | -11.68% | $209.55 | $185.07 |
|
82
|
28,617 M | CSGP | -11.83% | $76.58 | $67.52 |
|
83
|
18,546 M | CDW | -12.28% | $162.40 | $142.45 |
|
84
|
136,861 M | ADBE | -12.73% | $374.63 | $326.95 |
|
85
|
73,079 M | SNPS | -14.35% | $459.36 | $393.43 |
|
86
|
28,739 M | KHC | -14.81% | $28.50 | $24.28 |
|
87
|
102,795 M | ADP | -14.91% | $298.69 | $254.16 |
|
88
|
73,783 M | MDLZ | -15.75% | $67.87 | $57.18 |
|
89
|
231,531 M | TMUS | -16.19% | $247.00 | $207.00 |
|
90
|
103,890 M | VRTX | -17.92% | $498.86 | $409.47 |
|
91
|
21,025 M | TTD | -18.96% | $53.06 | $43.00 |
|
92
|
99,661 M | CMCSA | -19.13% | $33.82 | $27.35 |
|
93
|
48,119 M | ROP | -19.82% | $557.59 | $447.05 |
|
94
|
62,673 M | FTNT | -21.51% | $104.21 | $81.79 |
|
95
|
21,451 M | DXCM | -21.72% | $70.26 | $55.00 |
|
96
|
40,294 M | PAYX | -23.63% | $146.61 | $111.96 |
|
97
|
35,269 M | KDP | -23.74% | $34.04 | $25.96 |
|
98
|
61,197 M | TRI | -25.93% | $185.74 | $137.57 |
|
99
|
29,918 M | VRSK | -27.11% | $294.51 | $214.66 |
|
100
|
41,527 M | TEAM | -31.10% | $229.07 | $157.83 |
|
101
|
39,207 M | CPRT | -33.04% | $60.50 | $40.51 |
|
102
|
69,519 M | MSTR | -36.60% | $381.60 | $241.93 |
|
103
|
19,700 M | LULU | -38.15% | $268.60 | $166.13 |
|
104
|
28,452 M | CHTR | -42.60% | $383.00 | $219.86 |
Assuming 3% for the risk-free rate, the Sharpe Ratio for this investment is 2.85.
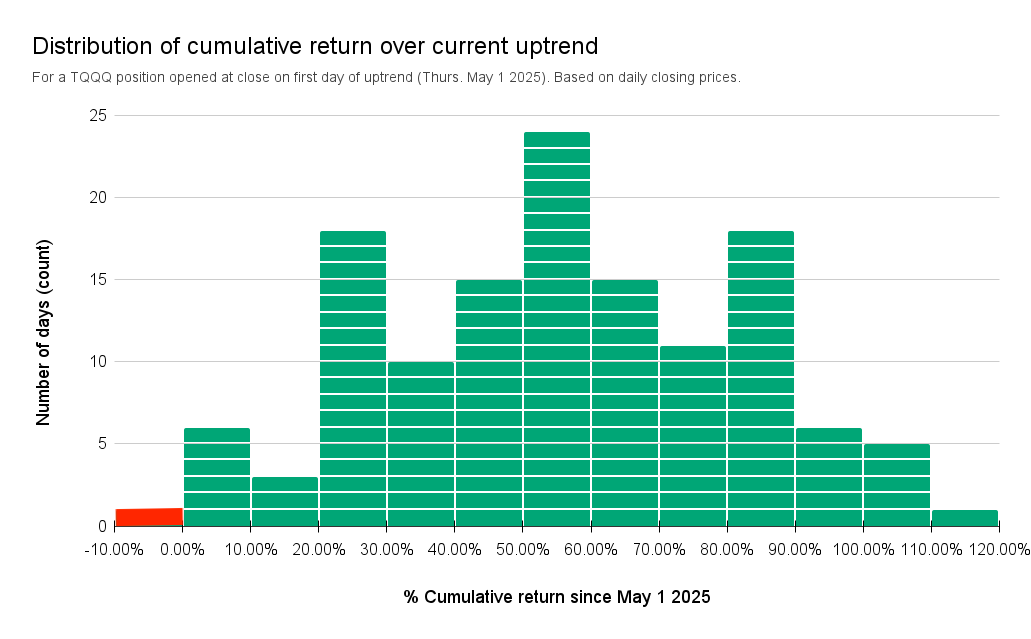
The distribution shows that the Market Signal was highly effective in identifying a sustained bullish phase. Nearly every daily close since the signal has maintained positive cumulative returns, with the highest concentration between +40% and +60%, and extreme outcomes reaching over +100%.
Disclaimer: The information that Raincheck Fund provides is general in nature as it has been prepared without taking account of your objectives, financial situation or needs. It is not intended as legal, financial or investment advice and should not be construed or relied on as such. Raincheck Fund is for information purposes only. Raincheck Fund is not responsible for any damages or losses that may occur as a result of reliance on this information. Before making any commitment of a legal or financial nature you should seek advice from a qualified and registered legal practitioner or financial or investment adviser.
All content, group, messaging, tweets, newsletter, article, and email created by Raincheck Fund is intended for educational and information purposes only, is not financial, investment, legal or tax advice, and is a restatement, summary or extract of other data and research reports that are widely distributed and publicly available. Raincheck Fund is not a registered financial, investment, legal or tax advisor and is not liable for any financial loss you may incur acting on any information provided by Raincheck Fund.
Investment advice provided solely by Autopilot advisers LLC, an SEC registered investment advisor. Past performance does not guarantee future results. Investing carries risks, including the risk of the loss of principal.
Investing in securities involves significant risk, including the risk of loss of principal. Past performance does not guarantee future results, and there can be no assurance that any investment strategy or security will meet its objectives or achieve any specific financial outcome. You should only invest risk capital that you can afford to lose without impacting your financial stability. Carefully consider your individual financial situation, investment goals, and risk tolerance before making any investment decisions.