Apr. 25th 2025
QQQ rallies
Market Signal: -5 MODERATE BEARISH
The NASDAQ-100 (QQQ) rallied a bit, closing +6.41% on the week. The Market Signal is out of STRONG BEARISH territory, and into MODERATE BEARISH territory.
QQQ is down -7.01% over the course of the current downtrend, while SQQQ is +0.80%, due to beta-slippage and the nature of a leveraged ETF.
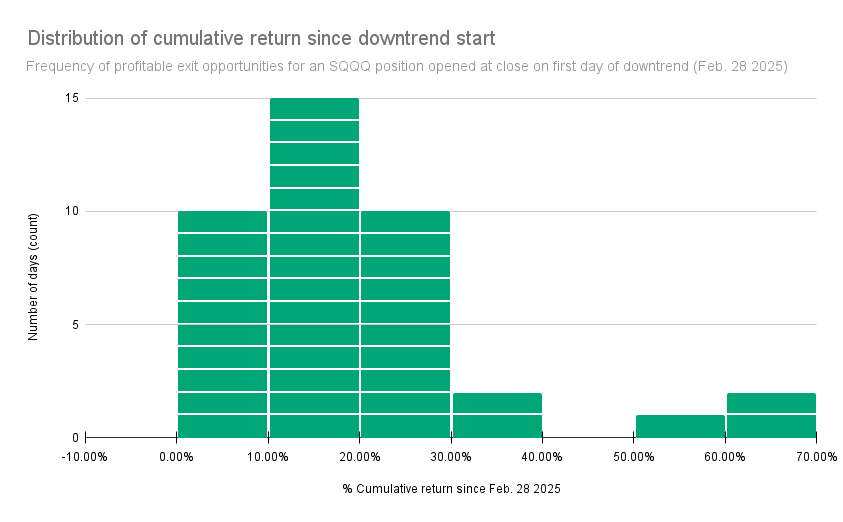
Still, SQQQ is beating 8 in 10 NASDAQ-100 holdings since the start of current downtrend. An SQQQ positioned opened on day 1 of uptrend saw zero days in the red and up to a +68.69% return:
NASDAQ-100 52-week lows
The following NASDAQ-100 (QQQ) holdings closed at a 52-week low today:
PEP $133.38 -1.43%ODFL $146.74 -7.65%
SQQQ (the inverse triple-leveraged (-3x) ETF for the NASDAQ-100) will be used in place of TQQQ in the next two sections benchmarking against QQQ and its holdings.📉40th day of downtrend
Day 📉1 of current downtrend occurred on Fri. Feb. 28th 2025.
QQQ-7.01% since start of current downtrendSQQQ+0.80% since start of current downtrend
| A | B | C | D | E | F | G | |
|---|---|---|---|---|---|---|---|
|
1
|
Market Signal | Trend Count | QQQ Close | QQQ %chg since 📉1 | SQQQ close | SQQQ %chg since 📉1 | Date |
|
2
|
-2 | 📉1 | $508.17 | 0.00% | $31.40 | 0.00% | Fri 2/28/25 |
|
3
|
-3 | 📉2 | $497.05 | -2.19% | $33.43 | 6.46% | Mon 3/3/25 |
|
4
|
-3 | 📉3 | $495.55 | -2.48% | $33.81 | 7.68% | Tue 3/4/25 |
|
5
|
-3 | 📉4 | $502.01 | -1.21% | $32.51 | 3.54% | Wed 3/5/25 |
|
6
|
-3 | 📉5 | $488.20 | -3.93% | $35.17 | 12.01% | Thu 3/6/25 |
|
7
|
-3 | 📉6 | $491.79 | -3.22% | $34.47 | 9.78% | Fri 3/7/25 |
|
8
|
-3 | 📉7 | $472.73 | -6.97% | $38.37 | 22.20% | Mon 3/10/25 |
|
9
|
-3 | 📉8 | $471.60 | -7.20% | $38.80 | 23.57% | Tue 3/11/25 |
|
10
|
-3 | 📉9 | $476.92 | -6.15% | $37.49 | 19.39% | Wed 3/12/25 |
|
11
|
-3 | 📉10 | $468.34 | -7.84% | $39.54 | 25.92% | Thu 3/13/25 |
|
12
|
-3 | 📉11 | $479.66 | -5.61% | $36.73 | 16.97% | Fri 3/14/25 |
|
13
|
-3 | 📉12 | $482.77 | -5.00% | $36.02 | 14.71% | Mon 3/17/25 |
|
14
|
-3 | 📉13 | $474.54 | -6.62% | $37.84 | 20.51% | Tue 3/18/25 |
|
15
|
-2 | 📉14 | $480.89 | -5.37% | $36.40 | 15.92% | Wed 3/19/25 |
|
16
|
-2 | 📉15 | $479.26 | -5.69% | $36.75 | 17.04% | Thu 3/20/25 |
|
17
|
-2 | 📉16 | $480.84 | -5.38% | $36.40 | 15.92% | Fri 3/21/25 |
|
18
|
-2 | 📉17 | $490.66 | -3.45% | $34.13 | 8.69% | Mon 3/24/25 |
|
19
|
-2 | 📉18 | $493.46 | -2.89% | $33.52 | 6.75% | Tue 3/25/25 |
|
20
|
-2 | 📉19 | $484.38 | -4.68% | $34.86 | 11.02% | Wed 3/26/25 |
|
21
|
-3 | 📉20 | $481.62 | -5.22% | $35.47 | 12.96% | Thu 3/27/25 |
|
22
|
-3 | 📉21 | $468.94 | -7.72% | $38.30 | 21.97% | Fri 3/28/25 |
|
23
|
-7 | 📉22 | $468.92 | -7.72% | $38.34 | 22.10% | Mon 3/31/25 |
|
24
|
-7 | 📉23 | $472.70 | -6.98% | $37.44 | 19.24% | Tue 4/1/25 |
|
25
|
-7 | 📉24 | $476.15 | -6.30% | $36.60 | 16.56% | Wed 4/2/25 |
|
26
|
-8 | 📉25 | $450.66 | -11.32% | $42.53 | 35.45% | Thu 4/3/25 |
|
27
|
-8 | 📉26 | $422.67 | -16.83% | $50.36 | 60.38% | Fri 4/4/25 |
|
28
|
-8 | 📉27 | $423.69 | -16.62% | $50.17 | 59.78% | Mon 4/7/25 |
|
29
|
-8 | 📉28 | $416.06 | -18.13% | $52.97 | 68.69% | Tue 4/8/25 |
|
30
|
-6 | 📉29 | $466.00 | -8.30% | $34.28 | 9.17% | Wed 4/9/25 |
|
31
|
-7 | 📉30 | $446.18 | -12.20% | $38.21 | 21.69% | Thu 4/10/25 |
|
32
|
-6 | 📉31 | $454.40 | -10.58% | $36.22 | 15.35% | Fri 4/11/25 |
|
33
|
-6 | 📉32 | $457.48 | -9.98% | $35.45 | 12.90% | Mon 4/14/25 |
|
34
|
-6 | 📉33 | $457.99 | -9.87% | $35.34 | 12.55% | Tue 4/15/25 |
|
35
|
-6 | 📉34 | $444.18 | -12.59% | $38.54 | 22.74% | Wed 4/16/25 |
|
36
|
-7 | 📉35 | $444.10 | -12.61% | $38.64 | 23.06% | Thu 4/17/25 |
|
37
|
-8 | 📉36 | $433.11 | -14.77% | $41.49 | 32.13% | Mon 4/21/25 |
|
38
|
-7 | 📉37 | $444.48 | -12.53% | $38.28 | 21.91% | Tue 4/22/25 |
|
39
|
-6 | 📉38 | $454.56 | -10.55% | $35.76 | 13.89% | Wed 4/23/25 |
|
40
|
-5 | 📉39 | $467.35 | -8.03% | $32.72 | 4.20% | Thu 4/24/25 |
|
41
|
-5 | 📉40 | $472.56 | -7.01% | $31.65 | 0.80% | Fri 4/25/25 |
Market Signal, Trend Count, closing prices, and return (%) over current downtrend
SQQQ vs QQQ Holdings
SQQQ is outperforming 79% of QQQ holdings since day 📉1 of current downtrend (Feb. 28th 2025).
In other words, there is about a 2 in 10 chance of having picked NASDAQ-100 holdings that outperformed SQQQ over the current downtrend.
| A | B | C | D | E | |
|---|---|---|---|---|---|
|
1
|
Market Cap | Symbol | %Chg since 📉1 | Close on 📉1 | Close |
|
2
|
171,421 M | QQQ | -7.01% | $508.17 | $472.56 |
|
3
|
99,143 M | MSTR | 44.35% | $255.43 | $368.71 |
|
4
|
264,509 M | PLTR | 32.81% | $84.92 | $112.78 |
|
5
|
79,449 M | CDNS | 15.62% | $250.50 | $289.63 |
|
6
|
47,003 M | AXON | 14.25% | $528.45 | $603.78 |
|
7
|
38,207 M | EA | 13.54% | $129.12 | $146.60 |
|
8
|
468,780 M | NFLX | 12.34% | $980.56 | $1,101.53 |
|
9
|
58,835 M | CPRT | 11.13% | $54.80 | $60.90 |
|
10
|
33,356 M | ZS | 9.86% | $196.23 | $215.58 |
|
11
|
105,316 M | CRWD | 9.04% | $389.66 | $424.88 |
|
12
|
34,930 M | CSGP | 8.62% | $76.25 | $82.82 |
|
13
|
57,095 M | MNST | 7.36% | $54.65 | $58.67 |
|
14
|
46,308 M | FAST | 6.60% | $75.73 | $80.73 |
|
15
|
39,779 M | TTWO | 6.32% | $211.98 | $225.38 |
|
16
|
112,845 M | MELI | 4.90% | $2,121.87 | $2,225.85 |
|
17
|
46,661 M | EXC | 4.57% | $44.20 | $46.22 |
|
18
|
126,957 M | VRTX | 2.93% | $479.79 | $493.84 |
|
19
|
53,064 M | CHTR | 2.77% | $363.57 | $373.65 |
|
20
|
46,721 M | KDP | 2.63% | $33.52 | $34.40 |
|
21
|
84,974 M | MDLZ | 2.12% | $64.23 | $65.59 |
|
22
|
40,371 M | CCEP | 1.88% | $86.26 | $87.88 |
|
23
|
174,480 M | INTU | 1.67% | $613.84 | $624.12 |
|
24
|
1,092 M | SQQQ | 0.80% | $31.40 | $31.65 |
|
25
|
56,998 M | AEP | 0.65% | $106.05 | $106.74 |
|
26
|
84,149 M | CTAS | 0.43% | $207.50 | $208.40 |
|
27
|
35,450 M | IDXX | 0.08% | $437.11 | $437.44 |
|
28
|
45,941 M | ROST | -0.43% | $140.32 | $139.71 |
|
29
|
2,913,006 M | MSFT | -1.29% | $396.99 | $391.85 |
|
30
|
57,495 M | ADSK | -1.56% | $274.21 | $269.93 |
|
31
|
76,797 M | ORLY | -1.94% | $1,373.64 | $1,347.00 |
|
32
|
92,304 M | KLAC | -2.01% | $708.84 | $694.61 |
|
33
|
69,056 M | SNPS | -2.33% | $457.28 | $446.62 |
|
34
|
917,811 M | TSLA | -2.74% | $292.98 | $284.95 |
|
35
|
157,013 M | AMD | -3.22% | $99.86 | $96.65 |
|
36
|
157,931 M | BKNG | -3.54% | $5,016.01 | $4,838.44 |
|
37
|
904,232 M | AVGO | -3.57% | $199.43 | $192.31 |
|
38
|
40,031 M | VRSK | -3.66% | $296.91 | $286.05 |
|
39
|
28,108 M | ANSS | -3.77% | $333.25 | $320.68 |
|
40
|
35,193 M | KHC | -3.97% | $30.71 | $29.49 |
|
41
|
212,054 M | LIN | -3.99% | $467.05 | $448.40 |
|
42
|
123,125 M | AMAT | -4.12% | $158.07 | $151.55 |
|
43
|
39,796 M | XEL | -4.30% | $72.10 | $69.00 |
|
44
|
266,303 M | ASML | -4.49% | $709.08 | $677.27 |
|
45
|
59,889 M | ROP | -4.59% | $584.50 | $557.70 |
|
46
|
1,997,332 M | GOOG | -4.86% | $172.22 | $163.85 |
|
47
|
1,974,292 M | GOOGL | -4.89% | $170.28 | $161.96 |
|
48
|
78,877 M | DASH | -5.38% | $198.44 | $187.76 |
|
49
|
164,307 M | QCOM | -5.48% | $157.17 | $148.56 |
|
50
|
126,573 M | CMCSA | -5.52% | $35.88 | $33.90 |
|
51
|
51,583 M | PAYX | -5.58% | $151.67 | $143.21 |
|
52
|
78,282 M | FTNT | -5.75% | $108.01 | $101.80 |
|
53
|
118,503 M | PANW | -6.01% | $190.43 | $178.98 |
|
54
|
128,111 M | HON | -6.45% | $212.89 | $199.16 |
|
55
|
433,550 M | COST | -6.81% | $1,048.61 | $977.16 |
|
56
|
91,629 M | LRCX | -6.93% | $76.74 | $71.42 |
|
57
|
118,709 M | ADP | -7.43% | $315.18 | $291.76 |
|
58
|
63,863 M | PYPL | -8.04% | $71.05 | $65.34 |
|
59
|
144,446 M | PDD | -8.51% | $113.69 | $104.01 |
|
60
|
215,692 M | AZN | -8.71% | $76.21 | $69.57 |
|
61
|
150,869 M | AMGN | -8.84% | $308.06 | $280.84 |
|
62
|
19,512 M | GFS | -8.98% | $38.77 | $35.29 |
|
63
|
64,070 M | WDAY | -9.04% | $263.34 | $239.53 |
|
64
|
128,447 M | GILD | -9.75% | $114.31 | $103.17 |
|
65
|
184,438 M | ISRG | -10.22% | $573.15 | $514.59 |
|
66
|
49,088 M | NXPI | -10.22% | $215.59 | $193.55 |
|
67
|
2,005,631 M | AMZN | -10.97% | $212.28 | $188.99 |
|
68
|
69,865 M | CEG | -11.00% | $250.55 | $222.99 |
|
69
|
2,708,644 M | NVDA | -11.14% | $124.92 | $111.01 |
|
70
|
20,813 M | CDW | -11.36% | $178.20 | $157.95 |
|
71
|
225,609 M | CSCO | -11.54% | $64.11 | $56.71 |
|
72
|
76,120 M | ABNB | -11.78% | $138.87 | $122.51 |
|
73
|
35,058 M | DDOG | -12.90% | $116.55 | $101.52 |
|
74
|
52,299 M | CSX | -13.03% | $32.01 | $27.84 |
|
75
|
182,875 M | PEP | -13.09% | $153.47 | $133.38 |
|
76
|
35,696 M | CTSH | -13.39% | $83.33 | $72.17 |
|
77
|
3,143,819 M | AAPL | -13.46% | $241.84 | $209.28 |
|
78
|
264,298 M | TMUS | -13.69% | $269.69 | $232.77 |
|
79
|
65,883 M | REGN | -13.75% | $698.74 | $602.64 |
|
80
|
119,460 M | ARM | -13.93% | $131.69 | $113.34 |
|
81
|
40,219 M | FANG | -13.97% | $158.96 | $136.76 |
|
82
|
48,236 M | PCAR | -14.31% | $107.24 | $91.89 |
|
83
|
89,160 M | MU | -14.79% | $93.63 | $79.78 |
|
84
|
93,669 M | APP | -15.02% | $325.74 | $276.83 |
|
85
|
96,512 M | ADI | -15.42% | $230.06 | $194.59 |
|
86
|
17,395 M | BIIB | -15.42% | $140.50 | $118.84 |
|
87
|
87,430 M | INTC | -15.51% | $23.73 | $20.05 |
|
88
|
16,726 M | ON | -15.77% | $47.05 | $39.63 |
|
89
|
65,043 M | MAR | -15.78% | $280.45 | $236.20 |
|
90
|
156,722 M | ADBE | -16.15% | $438.56 | $367.72 |
|
91
|
31,130 M | ODFL | -16.86% | $176.50 | $146.74 |
|
92
|
147,954 M | TXN | -16.90% | $195.99 | $162.86 |
|
93
|
1,381,556 M | META | -18.10% | $668.20 | $547.27 |
|
94
|
36,113 M | BKR | -18.26% | $44.59 | $36.45 |
|
95
|
28,098 M | DXCM | -18.91% | $88.37 | $71.66 |
|
96
|
59,914 M | TEAM | -19.55% | $284.26 | $228.68 |
|
97
|
25,218 M | MCHP | -20.34% | $58.86 | $46.89 |
|
98
|
31,326 M | GEHC | -21.67% | $87.35 | $68.42 |
|
99
|
26,530 M | TTD | -23.25% | $70.32 | $53.97 |
|
100
|
21,250 M | WBD | -25.04% | $11.46 | $8.59 |
|
101
|
32,319 M | LULU | -26.73% | $365.61 | $267.90 |
|
102
|
95,202 M | SBUX | -27.63% | $115.81 | $83.81 |
|
103
|
14,086 M | MDB | -35.12% | $267.43 | $173.50 |
|
104
|
51,028 M | MRVL | -35.83% | $91.82 | $58.92 |