Mar. 7th 2025
Downtrend begins
Market Signal: -3 WEAK BEARISH
Monday, March 3rd was the second consecutive day of negative Market Signal, marking the start of a new downtrend. The Market Signal remained negative, in WEAK BEARISH territory, all week.
During downtrends, Raincheck Fund focuses on SQQQor remains in cash.
The NASDAQ-100 (QQQ) is -3.22% since the start of the downtrend (Feb. 28th 2025), while SQQQ is +9.78%. SQQQ is outperforming QQQ and all of its holdings except for MSTR over this timeframe (see below).
In 2022, QQQ and its top holdings experienced significant drawdowns. Meanwhile SQQQ saw +92.16% annual returns.
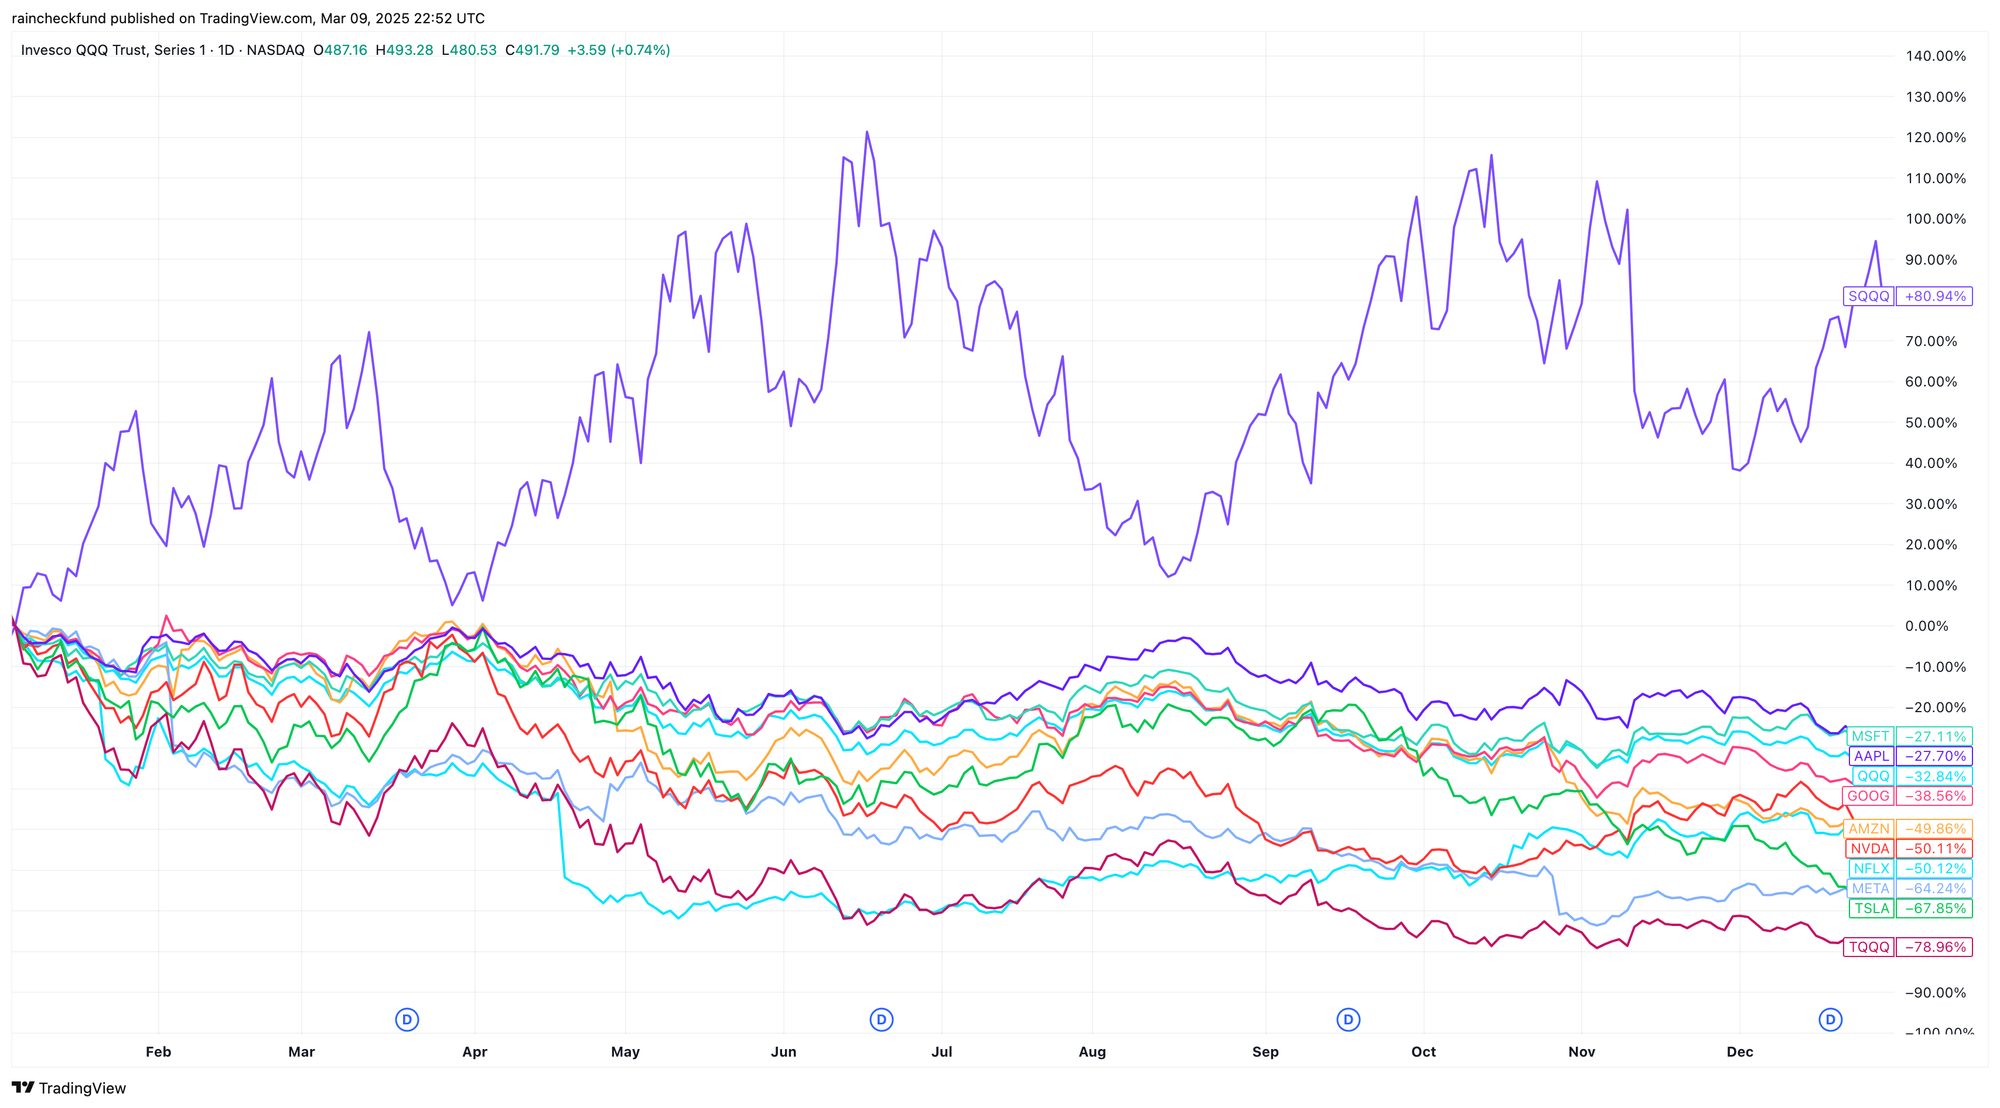
SQQQ outperforms QQQ and its holdings in 2022NASDAQ-100 52-week lows
The following NASDAQ-100 (QQQ) holdings closed at a 52-week low today:
TTD $64.91 -0.11%MDB $187.65 -2.76%
SQQQ (the inverse triple-leveraged (-3x) ETF for the NASDAQ-100) will be used in place of TQQQ in the next two sections benchmarking against QQQ and its holdings.📉6th day of downtrend
Day 📉1 of current downtrend occurred on Fri. Feb. 28th 2025.
QQQ-3.22% since start of current downtrendSQQQ+9.78% since start of current downtrend
| A | B | C | D | E | F | G | |
|---|---|---|---|---|---|---|---|
|
1
|
Market Signal | Trend Count | QQQ Close | QQQ %chg since 📉1 | SQQQ close | SQQQ %chg since 📉1 | Date |
|
2
|
-2 | 📉1 | $508.17 | 0.00% | $31.40 | 0.00% | Fri 2/28/25 |
|
3
|
-3 | 📉2 | $497.05 | -2.19% | $33.43 | 6.46% | Mon 3/3/25 |
|
4
|
-3 | 📉3 | $495.55 | -2.48% | $33.81 | 7.68% | Tue 3/4/25 |
|
5
|
-3 | 📉4 | $502.01 | -1.21% | $32.51 | 3.54% | Wed 3/5/25 |
|
6
|
-3 | 📉5 | $488.20 | -3.93% | $35.17 | 12.01% | Thu 3/6/25 |
|
7
|
-3 | 📉6 | $491.79 | -3.22% | $34.47 | 9.78% | Fri 3/7/25 |
Market Signal, Trend Count, closing prices, and return (%) over current downtrend
SQQQ vs QQQ Holdings
SQQQ is outperforming 99% of QQQ holdings since day 📉1 of current downtrend (Feb. 28th 2025).
Among NASDAQ-100 (QQQ) holdings, just 1 out of 100 companies (MSTR) has outperformed SQQQ over the current downtrend.
| A | B | C | D | E | |
|---|---|---|---|---|---|
|
1
|
Market Cap | Symbol | %Chg since 📉1 | Close on 📉1 | Close |
|
2
|
178,397 M | QQQ | -3.22% | $508.17 | $491.79 |
|
3
|
74,749 M | MSTR | 12.43% | $255.43 | $287.18 |
|
4
|
1,189 M | SQQQ | 9.78% | $31.40 | $34.47 |
|
5
|
36,497 M | EA | 8.46% | $129.12 | $140.04 |
|
6
|
22,012 M | BIIB | 7.03% | $140.50 | $150.38 |
|
7
|
32,032 M | ZS | 6.39% | $196.23 | $208.76 |
|
8
|
45,865 M | FAST | 5.61% | $75.73 | $79.98 |
|
9
|
166,541 M | PDD | 5.48% | $113.69 | $119.92 |
|
10
|
87,623 M | MDLZ | 5.46% | $64.23 | $67.74 |
|
11
|
174,516 M | AMGN | 5.45% | $308.06 | $324.86 |
|
12
|
38,455 M | KHC | 4.79% | $30.71 | $32.18 |
|
13
|
142,129 M | CMCSA | 4.77% | $35.88 | $37.59 |
|
14
|
53,872 M | CHTR | 4.39% | $363.57 | $379.52 |
|
15
|
33,484 M | CSGP | 4.12% | $76.25 | $79.39 |
|
16
|
287,909 M | ASML | 3.26% | $709.08 | $732.22 |
|
17
|
56,446 M | NXPI | 3.23% | $215.59 | $222.56 |
|
18
|
22,106 M | GFS | 3.17% | $38.77 | $40.00 |
|
19
|
101,422 M | LRCX | 2.96% | $76.74 | $79.01 |
|
20
|
146,216 M | GILD | 2.71% | $114.31 | $117.41 |
|
21
|
57,760 M | PCAR | 2.63% | $107.24 | $110.06 |
|
22
|
178,309 M | QCOM | 2.58% | $157.17 | $161.22 |
|
23
|
195,443 M | ADBE | 2.47% | $438.56 | $449.40 |
|
24
|
2,119,353 M | GOOGL | 2.10% | $170.28 | $173.86 |
|
25
|
2,142,393 M | GOOG | 2.05% | $172.22 | $175.75 |
|
26
|
125,388 M | VRTX | 1.77% | $479.79 | $488.29 |
|
27
|
38,162 M | ODFL | 1.73% | $176.50 | $179.55 |
|
28
|
240,276 M | AZN | 1.69% | $76.21 | $77.50 |
|
29
|
32,145 M | MCHP | 1.55% | $58.86 | $59.77 |
|
30
|
77,348 M | REGN | 1.26% | $698.74 | $707.51 |
|
31
|
42,150 M | VRSK | 1.20% | $296.91 | $300.48 |
|
32
|
55,262 M | PAYX | 1.19% | $151.67 | $153.48 |
|
33
|
139,421 M | HON | 0.77% | $212.89 | $214.52 |
|
34
|
53,592 M | MNST | 0.77% | $54.65 | $55.07 |
|
35
|
63,183 M | ROP | 0.66% | $584.50 | $588.38 |
|
36
|
211,814 M | PEP | 0.63% | $153.47 | $154.44 |
|
37
|
162,550 M | AMD | 0.45% | $99.86 | $100.31 |
|
38
|
221,687 M | LIN | 0.37% | $467.05 | $468.77 |
|
39
|
94,521 M | KLAC | 0.35% | $708.84 | $711.29 |
|
40
|
199,144 M | PLTR | -0.01% | $84.92 | $84.91 |
|
41
|
41,167 M | CTSH | -0.12% | $83.33 | $83.23 |
|
42
|
254,372 M | CSCO | -0.27% | $64.11 | $63.94 |
|
43
|
40,334 M | AXON | -0.39% | $528.45 | $526.40 |
|
44
|
45,234 M | KDP | -0.54% | $33.52 | $33.34 |
|
45
|
170,424 M | INTU | -0.69% | $613.84 | $609.61 |
|
46
|
103,573 M | MU | -0.72% | $93.63 | $92.96 |
|
47
|
69,722 M | PYPL | -0.80% | $71.05 | $70.48 |
|
48
|
39,593 M | GEHC | -0.88% | $87.35 | $86.58 |
|
49
|
2,923,860 M | MSFT | -0.93% | $396.99 | $393.31 |
|
50
|
3,591,327 M | AAPL | -1.15% | $241.84 | $239.07 |
|
51
|
55,784 M | AEP | -1.35% | $106.05 | $104.62 |
|
52
|
69,715 M | SNPS | -1.40% | $457.28 | $450.88 |
|
53
|
126,481 M | AMAT | -1.51% | $158.07 | $155.68 |
|
54
|
34,981 M | IDXX | -1.60% | $437.11 | $430.12 |
|
55
|
302,836 M | TMUS | -1.65% | $269.69 | $265.24 |
|
56
|
112,021 M | ADI | -1.83% | $230.06 | $225.86 |
|
57
|
51,918 M | CPRT | -1.93% | $54.80 | $53.74 |
|
58
|
81,944 M | CTAS | -2.14% | $207.50 | $203.06 |
|
59
|
916,688 M | AVGO | -2.24% | $199.43 | $194.96 |
|
60
|
28,540 M | ANSS | -2.29% | $333.25 | $325.61 |
|
61
|
59,226 M | CSX | -2.34% | $32.01 | $31.26 |
|
62
|
43,335 M | EXC | -2.47% | $44.20 | $43.11 |
|
63
|
124,686 M | ADP | -2.77% | $315.18 | $306.45 |
|
64
|
173,358 M | TXN | -2.79% | $195.99 | $190.52 |
|
65
|
66,666 M | CDNS | -2.91% | $250.50 | $243.21 |
|
66
|
44,857 M | ROST | -3.11% | $140.32 | $135.96 |
|
67
|
83,502 M | ABNB | -3.23% | $138.87 | $134.39 |
|
68
|
27,174 M | WBD | -3.40% | $11.46 | $11.07 |
|
69
|
19,133 M | ON | -3.51% | $47.05 | $45.40 |
|
70
|
36,063 M | TTWO | -3.61% | $211.98 | $204.33 |
|
71
|
42,466 M | BKR | -3.81% | $44.59 | $42.89 |
|
72
|
75,543 M | ORLY | -3.98% | $1,373.64 | $1,319.01 |
|
73
|
67,133 M | WDAY | -4.16% | $263.34 | $252.38 |
|
74
|
37,932 M | CCEP | -4.47% | $86.26 | $82.40 |
|
75
|
132,330 M | ARM | -4.66% | $131.69 | $125.55 |
|
76
|
119,794 M | PANW | -4.99% | $190.43 | $180.93 |
|
77
|
55,327 M | ADSK | -5.27% | $274.21 | $259.75 |
|
78
|
101,868 M | MELI | -5.30% | $2,121.87 | $2,009.34 |
|
79
|
22,308 M | CDW | -5.52% | $178.20 | $168.37 |
|
80
|
39,070 M | XEL | -5.69% | $72.10 | $68.00 |
|
81
|
41,937 M | LULU | -5.81% | $365.61 | $344.36 |
|
82
|
37,577 M | DDOG | -5.94% | $116.55 | $109.63 |
|
83
|
2,111,598 M | AMZN | -6.14% | $212.28 | $199.25 |
|
84
|
77,882 M | FTNT | -6.23% | $108.01 | $101.28 |
|
85
|
72,439 M | MAR | -6.31% | $280.45 | $262.75 |
|
86
|
1,585,209 M | META | -6.37% | $668.20 | $625.66 |
|
87
|
153,358 M | BKNG | -6.83% | $5,016.01 | $4,673.38 |
|
88
|
32,201 M | TTD | -7.69% | $70.32 | $64.91 |
|
89
|
427,893 M | COST | -8.04% | $1,048.61 | $964.31 |
|
90
|
120,954 M | SBUX | -8.06% | $115.81 | $106.48 |
|
91
|
381,179 M | NFLX | -9.12% | $980.56 | $891.11 |
|
92
|
184,841 M | ISRG | -9.58% | $573.15 | $518.26 |
|
93
|
2,749,636 M | NVDA | -9.79% | $124.92 | $112.69 |
|
94
|
74,811 M | DASH | -10.26% | $198.44 | $178.08 |
|
95
|
844,883 M | TSLA | -10.35% | $292.98 | $262.67 |
|
96
|
40,554 M | FANG | -11.86% | $158.96 | $140.11 |
|
97
|
30,418 M | DXCM | -11.92% | $88.37 | $77.84 |
|
98
|
89,371 M | INTC | -13.02% | $23.73 | $20.64 |
|
99
|
82,145 M | CRWD | -14.41% | $389.66 | $333.50 |
|
100
|
66,493 M | CEG | -15.17% | $250.55 | $212.54 |
|
101
|
62,581 M | TEAM | -15.97% | $284.26 | $238.86 |
|
102
|
91,952 M | APP | -16.96% | $325.74 | $270.48 |
|
103
|
61,298 M | MRVL | -22.85% | $91.82 | $70.84 |
|
104
|
15,100 M | MDB | -29.83% | $267.43 | $187.65 |